
在做GIS相关的工作过程中,是离不开矢量的数据的。矢量作为最基础的数据形式,一般通用在各个项目中。在导航软件开发或者应用中,点/线/面的标记,标绘,显示等都是不可缺少的。本文主要是来介绍在地图上基于OpenLayers实现点/线/面静态的绘制显示方法。
1、准备
本文的实现是在前文的框架基础上,继续添加点线面样式和显示函数。具体的准备内容包括ol库文件,瓦片地图服务等。参考:基于OpenLayers实现导航地图上(起/终)点的交互式图标显示的准备内容,和地图瓦片数据的多种利用形式以及瓦片数据的浏览显示的地图创建与后端服务启动。
2、创建矢量图层
在地图上增加点/线/面,则需要在地图之上增加一个矢量图层。
    //创建矢量图层
    var vecSource = new ol.source.Vector();
    var vecLayer = new ol.layer.Vector({
        source: vecSource
    });
    vecSource.clear();
    map.addLayer(vecLayer);//添加到map里面
注意:如果点线面公用一个图层,如果项目中有清除的功能,那么会使所有已存在的矢量均被清除。为此,根据项目需要,可创建多个矢量图层分别去控制point、line、polygon的要素,即可分别作用显示和清除。
3、点/线/面样式
样式的处理一般有两种方式:1、固定写法,放在之前,用时直接调用;2、不固定写法,在绘制的时候再写,可处理细节。
3.1、固定写法例子
//点样式
    var pointStyle = new ol.style.Style({
        image:new ol.style.Circle({
            radius:5,//半径
            fill:new ol.style.Fill({
                color:'red'
            }),    //填充颜色
            stroke: new ol.style.Stroke({
                color: 'green',
                width: 1
            })//外环颜色和粗细
        })
    })

    //线样式
    var lineStyle = new ol.style.Style({
        stroke: new ol.style.Stroke({
            color: 'blue',
            width: 3
        })
    })
    //面样式
    var polygonStyle = new ol.style.Style({
        text:new ol.style.Text({
            testAlign:'center',
            text:"区域",
               font:'bold 20px 微软雅黑',
            fill:new ol.style.Fill({
                color:'#19339e'
              })
        }),
        fill: new ol.style.Fill({
            color: '#0055ff'
            }),
        stroke: new ol.style.Stroke({
            color: '#ffcc33',
            width: 3
        })
    })
上面写的例子可以看出,写死后,直接调用,样式基本就固定了。细微细节想要变化不太好处理了。
3.2、不固定写法例子
直接在对点线面绘制遍历过程逐一添加样式,可以增加细节上的优化。
            //点样式
            var pointStyle = new ol.style.Style({
                text:new ol.style.Text({
                    testAlign:'left',
                    text:i+"     ",             ///可变化
                    font:'bold 15px 微软雅黑',
                    fill:new ol.style.Fill({
                        color:'yellow'
                    })
                }),
                image:new ol.style.Circle({
                    radius:r,//半径
                    fill:new ol.style.Fill({
                        color:c1
                    }),    //填充颜色
                    stroke: new ol.style.Stroke({
                        color: c2,
                        width: w
                    })//渐变颜色和大小
                })
            });
点样式放在每个点要素的绘制过程中,可以对每个点要素进行标注等等,而固定写法则没法做到序号标注。
            var pFeature = new ol.Feature(geoPoint);
            //pFeature.setStyle(pointStyle);
            pFeature.setStyle(new ol.style.Style({
                 text:new ol.style.Text({
                     testAlign:'left',
                     text:i+"    ",
                     font:'bold 20px 微软雅黑',
                     fill:new ol.style.Fill({
                         color:'red'
                     })
                 }),
            }));
线样式中则可以对每个节点进行标注,处理显示。
            var polygonStyle = new ol.style.Style({
                text:new ol.style.Text({
                    testAlign:'center',
                    text:"区域"+i,
                       font:'bold 20px 微软雅黑',
                    fill:new ol.style.Fill({
                        color:'black'
                      })
                }),
                fill: new ol.style.Fill({
                    color: '#0055ff'
                   }),
                stroke: new ol.style.Stroke({
                    color: '#ffcc33',
                    width: 3
                })
            });
面样式放在每个面要素的绘制过程中进行渲染,可以获得想要的标注等样式。
4、显示效果
为显示效果模拟的数据:
var vectorlist = {"point":[[113.76101 , 23.52712],[113.73627 , 23.51769],[113.76506 , 23.51675],[113.74415 , 23.49535],[113.74415 , 23.49995],[113.75082 , 23.49976],[113.319 , 23.140],[113.319 , 23.109],[113.3386 , 23.1238]],"line":[[113.3386 , 23.1238],[113.4506 , 23.2675],[113.5415 , 23.49535],[113.74415 , 23.49995]],"polygon":["[[113.319 , 23.140],[113.319 , 23.109],[113.3386 , 23.1238]]","[[113.76101 , 23.52712],[113.73627 , 23.51769],[113.74415 , 23.49995],[113.76506 , 23.51675]]"]}
4.1、点显示
代码:
    function drawPoint(PointList){

        vecSource.clear();

        var points = PointList.point;//使用过程中需要修改为被请求服务中的字段

        for(var i=0;i<points.length;i++){

            var point = new ol.geom.Point(ol.proj.fromLonLat(points[i]));
            var feature = new ol.Feature(point);
            var pointStyle = new ol.style.Style({
                text:new ol.style.Text({
                    testAlign:'left',
                    text:i+"     ",
                    font:'bold 15px 微软雅黑',
                    fill:new ol.style.Fill({
                        color:'yellow'
                    })
                }),
                image:new ol.style.Circle({
                    radius:5,//半径
                    fill:new ol.style.Fill({
                        color:'red'
                    }),    //填充颜色
                    stroke: new ol.style.Stroke({
                        color: 'blue',
                        width: 1
                    })//渐变颜色和大小
                })
            });
            feature.setStyle(pointStyle);
            vecSource.addFeature(feature);
        }
    }
那么直接调用:
drawPoint(vectorlist);
得到效果有:


4.2、线显示
代码:
    function drawLine(LineList){

        vecSource.clear();

        var lines = LineList.line;

        var line = new ol.geom.LineString();
        for(var i = 0;i < lines.length;i++){

            // var pPoint = ol.proj.transform([lines[i][0]*1,lines[i][1]*1], 'EPSG:4326', 'EPSG:3857');
            // line.appendCoordinate(pPoint);
            // var geoPoint = new ol.geom.Point([pPoint[0]*1,pPoint[1]*1]);

            line.appendCoordinate(ol.proj.fromLonLat(lines[i]));
            //标记每一个节点
            var geoPoint = new ol.geom.Point([ol.proj.fromLonLat(lines[i])[0]*1,ol.proj.fromLonLat(lines[i])[1]*1]);
            var pFeature = new ol.Feature(geoPoint);
            //pFeature.setStyle(pointStyle);
            pFeature.setStyle(new ol.style.Style({
                text:new ol.style.Text({
                    testAlign:'left',
                    text:i+"    ",
                    font:'bold 20px 微软雅黑',
                    fill:new ol.style.Fill({
                        color:'red'
                    })
                }),
            }));
            vecSource.addFeature(pFeature);
        }

        var feature = new ol.Feature(line);

        feature.setStyle(lineStyle);
        vecSource.addFeature(feature);
    }
效果:

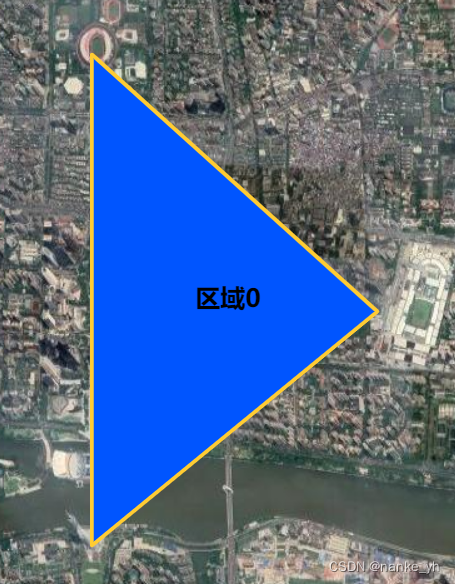
4.3、面显示
代码:
    function drawPolygon(PloygonList){
        vecSource.clear();
        var ploys = PloygonList.polygon;
        for(var i=0;i < ploys.length;i++){
            var ploy = ploys[i];
            var json = JSON.parse(ploy);
            var polygon = new ol.geom.Polygon([json]);
            polygon.applyTransform(ol.proj.getTransform('EPSG:4326', 'EPSG:3857'));
            var feature = new ol.Feature(polygon);
            var polygonStyle = new ol.style.Style({
                text:new ol.style.Text({
                    testAlign:'center',
                    text:"区域"+i,
                       font:'bold 20px 微软雅黑',
                    fill:new ol.style.Fill({
                        color:'black'
                      })
                }),
                fill: new ol.style.Fill({
                    color: '#0055ff'
                   }),
                stroke: new ol.style.Stroke({
                    color: '#ffcc33',
                    width: 3
                })
            });
            feature.setStyle(polygonStyle);
            vecSource.addFeature(feature);
        }

    }
效果:

5、结束
    由于个人喜好因素,矢量数据表现形式可能存在无数样式。所以往往大家有喜欢定制化的。那么在细节之处传入喜好的参数,就能够得到自己想要的样式了。所以有时候则需要将函数改动的更为灵活,这里静态显示其实也体现不出这种形式的好处,如若改为交互式的情形,那么所有配置参数将都可让用户自己设置。

    这里仅用点显示函数做例子,其他的都类似:
function drawPoint(PointList,c1,c2,r,w){

        vecSource.clear();

        var points = PointList.point;//使用过程中需要修改为被请求服务中的字段

        for(var i=0;i<points.length;i++){

            var point = new ol.geom.Point(ol.proj.fromLonLat(points[i]));
            var feature = new ol.Feature(point);
            var pointStyle = new ol.style.Style({
                text:new ol.style.Text({
                    testAlign:'left',
                    text:i+"     ",
                    font:'bold 15px 微软雅黑',
                    fill:new ol.style.Fill({
                        color:'yellow'
                    })
                }),
                image:new ol.style.Circle({
                    radius:r,//半径
                    fill:new ol.style.Fill({
                        color:c1
                    }),    //填充颜色
                    stroke: new ol.style.Stroke({
                        color: c2,
                        width: w
                    })//渐变颜色和大小
                })
            });
            feature.setStyle(pointStyle);
            vecSource.addFeature(feature);
        }
    }
这里就可以将,点要素的半径、填充颜色、渐变色和大小都定制化选择了。
本文转载自: https://blog.csdn.net/nanke_yh/article/details/128232361
版权归原作者 nanke_yh 所有, 如有侵权,请联系我们删除。
版权归原作者 nanke_yh 所有, 如有侵权,请联系我们删除。