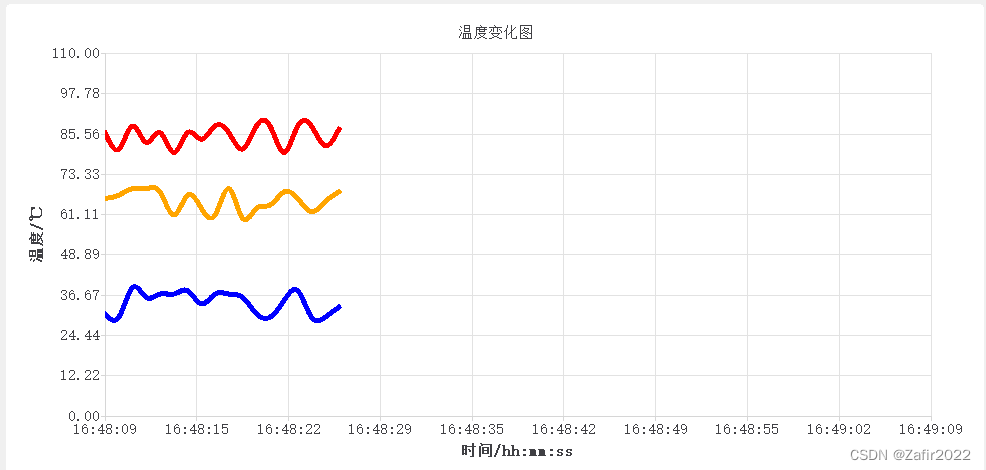
前言:因为有个项目要实现将热像仪传过来的温度图像实时的显示在图表中,所以用到QChartView来显示,网上没有找到这种实时更新温度数据曲线的方法,于是自己琢磨了一下,实现了显示动态的温度曲线。
一、UI设计界面中添加QChartView控件。
1)在工程的.pro文件头部加上charts的支持,如下。
QT += charts
2)ui设计界面拖动Widget到界面上,鼠标右键选择“提升为...”菜单,在“提升的类名称:”输入框中输入QChartView,点击“添加”,将QChartView添加到列表。然后选中上面列表中添加的QChartView控件,点击“提升”按钮即可。
3)若出现编译错误,可以搜索下,能找到解决方法。
二、C++头文件中定义温度曲线图相关的变量和方法。
// 在头文件中添加
    // 上一次刷新图表的时间,结合refreshTempChartTimeGap参数控制图表刷新频率
    static qint64 preUpdateTempChartTime;
    // 在绘制温度曲线的控件上,显示的点个数,
    // 如果每秒钟刷新一次数据(refreshTempChartTimeGap=1000),则控件上显示60个点,横轴显示60秒内的数据
    const int showTempPointMaxCount = 60;
    // 刷新一次温度数据的时间间隔,单位毫秒,越小刷新越快。
    // 结合showTempMaxCount参数表示:图表显示的时间范围为
    showTempPointMaxCount*refreshTempChartTimeGap
    static const int refreshTempChartTimeGap = 1000;
    // 图表第一次显示时间
    QDateTime chartViewFirstShowTime;
    // 添加最大、最小、平均温度的点坐标序列
    QSplineSeries * globalMaxTempSplineSeres = NULL;
    QSplineSeries * globalMinTempSplineSeres = NULL;
    QSplineSeries * globalAvgTempSplineSeres = NULL;
    // 2022.11.30 新增 @{
    QChart *chart = NULL;
    QDateTimeAxis *dateTimeAxisX = NULL;
    QValueAxis *valueAxisY = NULL;
    // @}
    /** 初始化显示时间-温度的表视图**/
    void initTempChartView();
    /** 显示并更新时间-温度(最高、最低、平均温)图,所有温度同时更新,刷新图表函数*/
    void showTempChartView(float maxTemp, float minTemp, float avgTemp);
三、 C++源文件中初始化变量和方法的具体实现。
//初始化静态变量
qint64 TempSettings::preUpdateTempChartTime = 0;
void TempSettings::initTempChartView()
{
    // 创建图表;
    if (chart == NULL) {
        chart = new QChart();
    }

    // 创建坐标轴;
    if (dateTimeAxisX == NULL) {
        dateTimeAxisX = new QDateTimeAxis();
    }

    if (valueAxisY == NULL) {
        valueAxisY = new QValueAxis();
    }

    valueAxisY->setRange(0, 110);
    // 设置坐标轴标题和显示格式;
    dateTimeAxisX->setTitleText("时间/hh:mm:ss");
    valueAxisY->setTitleText("温度/℃");
    dateTimeAxisX->setFormat("hh:mm:ss");
    valueAxisY->setLabelFormat("%.2f");
    //设置坐标轴的精度;分成多少份(多少个刻度),最小间隔为Range/(TickCount - 1)
    dateTimeAxisX->setTickCount(10);
    valueAxisY->setTickCount(10);
    // 图表添加坐标轴;
    chart->addAxis(dateTimeAxisX,Qt::AlignBottom);
    chart->addAxis(valueAxisY,Qt::AlignLeft);
    // 设置图表的标题以及图例显示;
    chart->setTitle("温度变化图");
    chart->legend()->hide();

    globalMaxTempSplineSeres = new QSplineSeries;
    globalMinTempSplineSeres = new QSplineSeries;
    globalAvgTempSplineSeres = new QSplineSeries;

    //设置最大温度曲线的颜色;
    QPen globalMaxTempPen(QColor(0xFF0000));
    globalMaxTempPen.setWidth(5);
    globalMaxTempSplineSeres->setPen(globalMaxTempPen);

    // 设置最小温度曲线的颜色;
    QPen globalMinTempPen(QColor(0x0000ff));
    globalMinTempPen.setWidth(5);
    globalMinTempSplineSeres->setPen(globalMinTempPen);

    // 设置平均温度曲线的颜色;
    QPen globalAvgTempPen(QColor(0xffa500));
    globalAvgTempPen.setWidth(5);
    globalAvgTempSplineSeres->setPen(globalAvgTempPen);

    // 图表添加线;
    chart->addSeries(globalMaxTempSplineSeres);
    chart->addSeries(globalMinTempSplineSeres);
    chart->addSeries(globalAvgTempSplineSeres);
    // 将曲线和坐标轴联系起来;
    globalMaxTempSplineSeres->attachAxis(dateTimeAxisX);
    globalMaxTempSplineSeres->attachAxis(valueAxisY);
    globalMinTempSplineSeres->attachAxis(dateTimeAxisX);
    globalMinTempSplineSeres->attachAxis(valueAxisY);
    globalAvgTempSplineSeres->attachAxis(dateTimeAxisX);
    globalAvgTempSplineSeres->attachAxis(valueAxisY);
    // 将图表放置在图表视图显示出来;
    ui->chartView->setChart(chart);
}

void TempSettings::showTempChartView(float maxTemp, float minTemp, float avgTemp)
{
    if (globalMaxTempSplineSeres == NULL ||
            globalMinTempSplineSeres == NULL ||
            globalAvgTempSplineSeres == NULL) {
        return;
    }

    // 当前时间
    QDateTime currentDateTime = QDateTime::currentDateTime();
    // 设置坐标轴范围;
    // 确保点没有填满整个图表时,实现线段从左边逐渐往右边延伸的效果。放在splineseres.append()之前
    // 数据还没有填满整个图表时,范围固定。起始时间为第一次显示的时间。填满图表后,条件不会满足,不会去设置范围,由x值自动控制
    if (globalMaxTempSplineSeres->points().size() < showTempPointMaxCount) {
        // 时间刻度最大值
        QDateTime rangeMaxDateTime;
        // 是否使用第一次计算的时间为横坐标最大时间
        bool useFirstClacRangeMax = true;
        // 记录起始时间
        if (globalMaxTempSplineSeres->points().size() == 0) {
            // 实际上画的第一个点是看不到的,第一次看到的第二个点
            chartViewFirstShowTime = currentDateTime;
        } else {
            // 如果这个函数不在定时器中执行,那else中的代码很有必要
            qint64 lastPointX = currentDateTime.toMSecsSinceEpoch();
            // 微调最大横坐标刻度值。因为有种情况是这样:温度数据更新时间间隔比图表刷新更快。
            // 比如数据100毫秒更新一次,图表我想1秒钟刷新一次。此时计算的最大横坐标刻度就偏小了。
            if (chartViewFirstShowTime.addMSecs(showTempPointMaxCount
                                                * refreshTempChartTimeGap)
                                                .toMSecsSinceEpoch() < lastPointX) {
                // 设置的范围最大值小于最后一个点的x坐标,则调整成最后一个点的x坐标值
                rangeMaxDateTime = QDateTime::fromMSecsSinceEpoch(lastPointX);
                useFirstClacRangeMax = false;
            }
        }
        if (useFirstClacRangeMax) {
            rangeMaxDateTime = chartViewFirstShowTime.addMSecs(showTempPointMaxCount * refreshTempChartTimeGap);
        }
        dateTimeAxisX->setRange(chartViewFirstShowTime, rangeMaxDateTime);
    }
    // 添加最新数据
    QPointF maxTempPointF;
    maxTempPointF.setX(currentDateTime.toMSecsSinceEpoch());
    maxTempPointF.setY(maxTemp);
    globalMaxTempSplineSeres->append(maxTempPointF);

    QPointF minTempPointF;
    minTempPointF.setX(currentDateTime.toMSecsSinceEpoch());
    minTempPointF.setY(minTemp);
    globalMinTempSplineSeres->append(minTempPointF);

    QPointF avgTempPointF;
    avgTempPointF.setX(currentDateTime.toMSecsSinceEpoch());
    avgTempPointF.setY(avgTemp);
    globalAvgTempSplineSeres->append(avgTempPointF);

    // 显示固定个数,刷新图表的关键代码
    if (globalMaxTempSplineSeres->points().size() > showTempPointMaxCount) {
        // 移除最前面的一个,过时的/不显示的数据
        globalMaxTempSplineSeres->remove(0);
        globalMinTempSplineSeres->remove(0);
        globalAvgTempSplineSeres->remove(0);
        // 保存后续的所有点,要显示的
        QList<QPointF> maxTempPoints = globalMaxTempSplineSeres->points();
        QList<QPointF> minTempPoints = globalMinTempSplineSeres->points();
        QList<QPointF> avgTempPoints = globalAvgTempSplineSeres->points();
        // 清空
        globalMaxTempSplineSeres->clear();
        globalMinTempSplineSeres->clear();
        globalAvgTempSplineSeres->clear();
        // 重新加入
        for (int i = 0; i < maxTempPoints.size(); i++) {
            globalMaxTempSplineSeres->append(maxTempPoints.at(i));
            globalMinTempSplineSeres->append(minTempPoints.at(i));
            globalAvgTempSplineSeres->append(avgTempPoints.at(i));
        }
        //2022.11.30 增加语句 根据当前点确定横坐标范围
        dateTimeAxisX->setRange(QDateTime::fromMSecsSinceEpoch(maxTempPoints.at(0).x()), QDateTime::fromMSecsSinceEpoch(maxTempPoints.at(maxTempPoints.size() - 1).x()));
    }
}
四、 调用更新图表方法的两种方式。
1)定时器中执行,切记,只执行一次即可。
    // 如果在更新温度数据处调用,则下列代码只执行一次。showTempChartView方法中的参数替换为全局变量中的对应三个值,这三个值会不断变化。
    QTimer *updateChartViewTimer;
    updateChartViewTimer = new QTimer(this);
    connect(updateChartViewTimer, &QTimer::timeout,this,[=]() {
            // 参数为模拟数据,根据实际替换成变量
            showTempChartView(80 + rand() % 10, 30 + rand() % 10, 60 + rand() % 10);
    });
    // 每隔refreshTempChartTimeGap执行一次,也就实现定时刷新图表数据
    updateChartViewTimer->start(refreshTempChartTimeGap);
**2)在温度数据改变时去执行,不需要定时器。 **
// 实时更新温度的函数
void onUpdateTemp(float maxTemp, float minTemp, float avg) {
        // 更新显示温度的图表
    if (QDateTime::currentMSecsSinceEpoch() - preUpdateTempChartTime >=     refreshTempChartTimeGap) {
        preUpdateTempChartTime = QDateTime::currentMSecsSinceEpoch();
        showTempChartView(maxTemp, minTemp, avg);
    }
}
两种调用方法各有优缺点。
使用第一种方法的优点:在第一次线填满整个图表后(图表中点达到最大值),图表再刷新一次,线段整体立马会往左边移动,不会出现把线段压缩长度以便适配图表控件宽度的问题。 缺点:如果温度数据变化太慢(温度刷新比图表刷新更慢),图表上新增的显示点温度数据可能是上一次的,即图表中的有些点(y值)可能是重复的。当然可以调整定时器时间间隔,达到最佳效果。
使用第二种方法的优点:也是避免第一种方法的缺点,即图标上每个点(y值)都是新的,因为调用是温度更新时才调用,保证了数据都是最新的。缺点:在图表刷新时间间隔(refreshTempChartTimeGap)大于温度数据更新时间间隔,而且显示的点数(showTempPointMaxCount )又设置比较大时,在第一次线填满整个图表后(图表中点达到最大值),图表再刷新一次,线段整体不会立马往左边移动,会出现把线段压缩长度以便适配图表控件宽度的问题,当然数据在图表上显示是完全正确的。
总体来说使用第二种方法更合适,不用到定时器,定时器的时间也不用去考虑了。被动调用,数据准确。
**五、析构函数中,释放指针。 **
    // 析构函数中,释放指针。
    // 删除图表相关指针
    delete globalMaxTempSplineSeres;
    delete globalMinTempSplineSeres;
    delete globalAvgTempSplineSeres;
    delete dateTimeAxisX;
    delete valueAxisY;
    delete chart;
2022.11.30更新初始化和显示图表的代码,增加析构函数删除指针代码,解决showTempChartView函数内存泄漏问题。

版权归原作者 Zafir2022 所有, 如有侵权,请联系我们删除。