通过SpringBoot+百度地图+Mysql实现中国地图可视化
一、申请百度地图的ak值
进入百度开发者平台
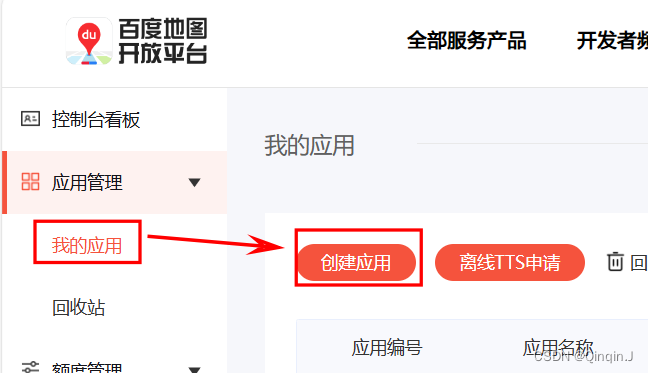
编辑以下内容
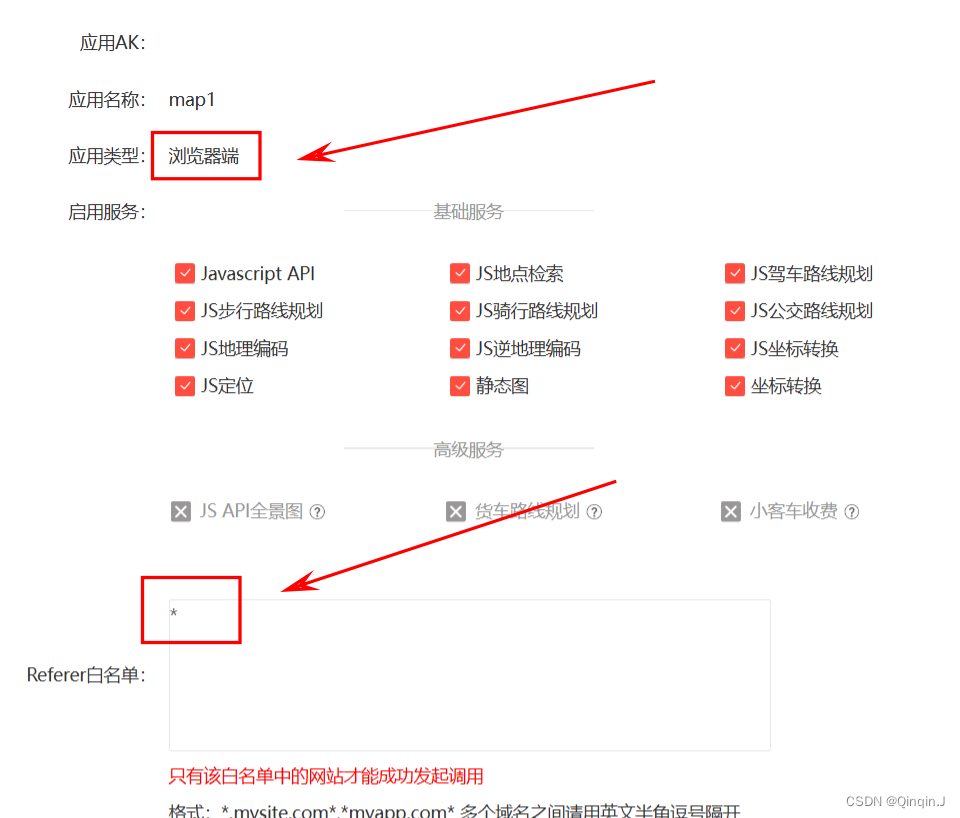
然后申请成功
二、Springboot写一个接口
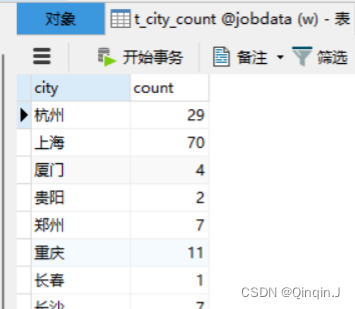
确保数据库里有数据
文件目录如下
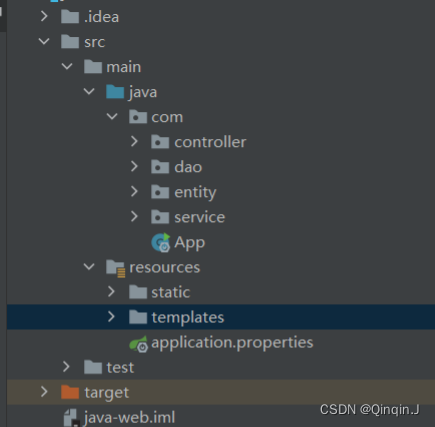
1、配置application.properties文件
#访问端口号
server.port=9090
# 数据库连接信息
spring.datasource.driver-class-name=com.mysql.cj.jdbc.Driver
spring.datasource.url=jdbc:mysql://localhost:3306/JobData?serverTimezone=UTC
spring.datasource.username=root
spring.datasource.password=1234
# 连接池配置
spring.datasource.type=com.alibaba.druid.pool.DruidDataSource
spring.datasource.druid.initial-size=20
spring.datasource.druid.min-idle=10
spring.datasource.druid.max-active=100
# 实体类使用驼峰命名。数据库使用下划线
mybatis.configuration.map-underscore-to-camel-case=true
2、配置pom.xml文件
   <parent>
        <artifactId>spring-boot-test</artifactId>
        <groupId>org.springframework.boot</groupId>
        <version>2.1.3.RELEASE</version>
    </parent>

<dependencies>
        <dependency>
            <groupId>org.springframework.boot</groupId>
            <artifactId>spring-boot-starter-web</artifactId>
        </dependency>

        <!--视图依赖-->
        <dependency>
            <groupId>org.springframework.boot</groupId>
            <artifactId>spring-boot-starter-thymeleaf</artifactId>
        </dependency>
        <!--实体类代码简化依赖-->
        <dependency>
            <groupId>org.projectlombok</groupId>
            <artifactId>lombok</artifactId>
            <version>1.18.22</version>
        </dependency>
        <!--引入数据库的依赖-->
        <dependency>
            <groupId>org.mybatis.spring.boot</groupId>
            <artifactId>mybatis-spring-boot-starter</artifactId>
            <version>2.1.1</version>
        </dependency>
        <dependency>
            <groupId>mysql</groupId>
            <artifactId>mysql-connector-java</artifactId>
            <scope>runtime</scope>
        </dependency>
        <dependency>
            <groupId>com.alibaba</groupId>
            <artifactId>druid-spring-boot-starter</artifactId>
            <version>1.1.10</version>
        </dependency>
        <!--Mybatis-->
        <dependency>
            <groupId>org.mybatis.spring.boot</groupId>
            <artifactId>mybatis-spring-boot-starter</artifactId>
            <version>2.2.0</version>
        </dependency>
        <!--mybatis-plus-->
        <dependency>
            <groupId>com.baomidou</groupId>
            <artifactId>mybatis-plus-boot-starter</artifactId>
            <version>3.1.2</version>
        </dependency>
</dependencies>
3、编写com/App.java启动类
package com;

import org.springframework.boot.SpringApplication;
import org.springframework.boot.autoconfigure.SpringBootApplication;

@SpringBootApplication
public class App {
    // 调用SpringApplication的run方法来启动Spring Boot应用程序。
    // 传入的App.class参数指定了应用程序的启动类。
    public static void main(String[] args) {
        SpringApplication.run(App.class);
    }
}
4、编写controller/CityController.java
package com.controller;

import com.entity.CityEntity;
import com.service.CityService;
import org.springframework.beans.factory.annotation.Autowired;
import org.springframework.web.bind.annotation.RequestMapping;
import org.springframework.web.bind.annotation.RestController;

import java.util.List;

@RestController
@RequestMapping("city")
public class CityController {

    @Autowired
    private CityService cityService;

    @RequestMapping("list")
    public List<CityEntity> list() {

        return cityService.list();
    }
}
5、编写
5、编写dao/CityDao.java
package com.dao;

import com.baomidou.mybatisplus.core.mapper.BaseMapper;
import com.entity.CityEntity;
import org.apache.ibatis.annotations.Mapper;

@Mapper
public interface CityDao extends BaseMapper<CityEntity> {

}
6、编写entity/CityEntity.java
封装数据库字段信息
package com.entity;

import com.baomidou.mybatisplus.annotation.TableName;
import lombok.*;

@NoArgsConstructor
@AllArgsConstructor
@Getter
@Setter
@Data
@TableName("t_city_count")  //数据库表名
public class CityEntity {
    private String city;
    private int count;
}
7、编写service/CityService.java
package com.service;

import com.baomidou.mybatisplus.extension.service.IService;
import com.entity.CityEntity;

public interface CityService extends IService<CityEntity> {
}
8、编写service/impl/CityServiceImpl.java

package com.service.impl;

import com.baomidou.mybatisplus.extension.service.impl.ServiceImpl;
import com.dao.CityDao;
import com.entity.CityEntity;
import com.service.CityService;
import org.springframework.stereotype.Service;

@Service("CityService")
public class CityServiceImpl extends ServiceImpl<CityDao, CityEntity> implements CityService {
}
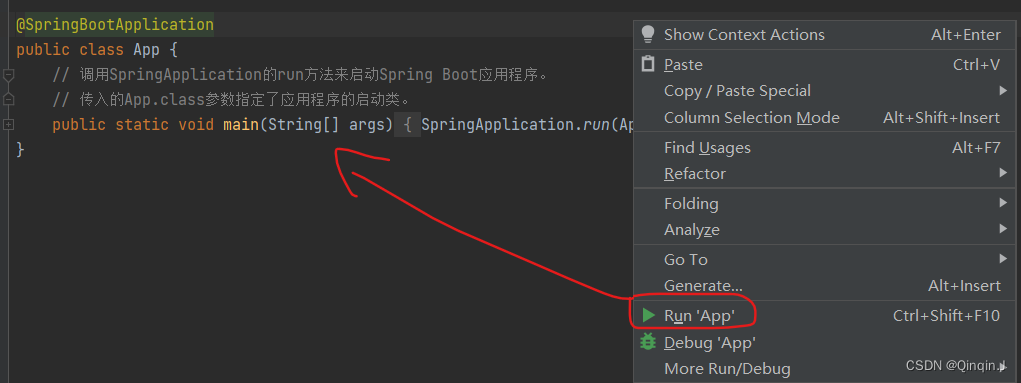
9、启动App类
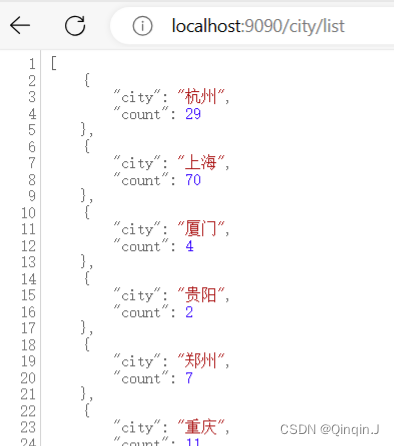
结果:
访问端口
http://localhost:9090/city/list
得到数据
三、可视化
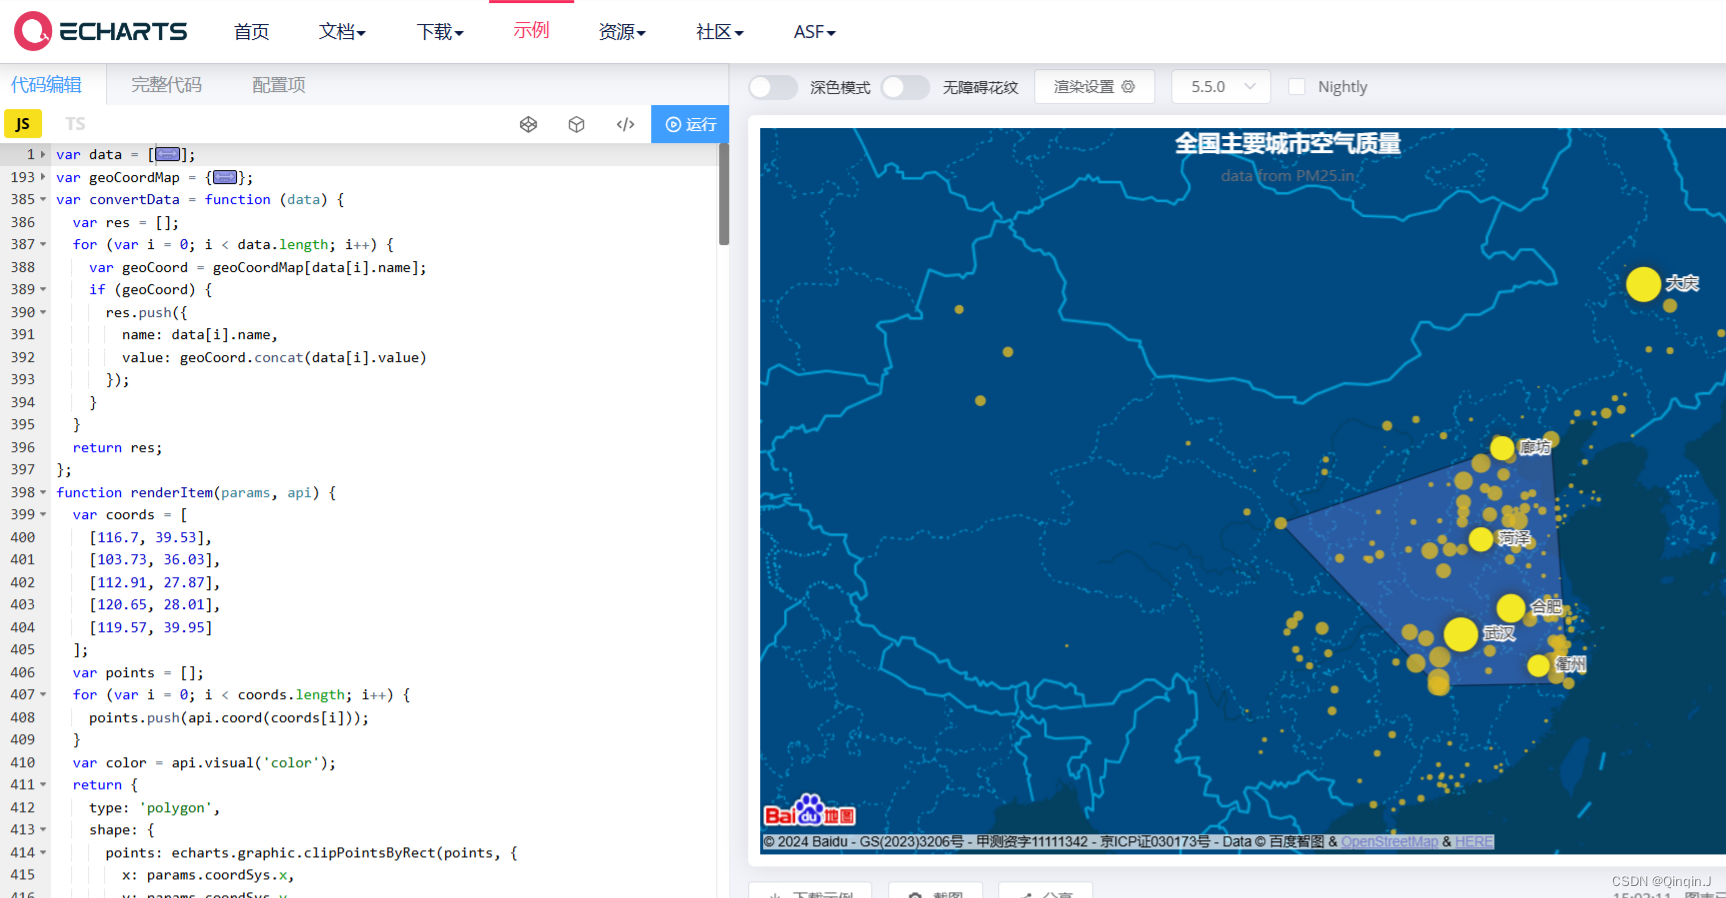
1、选择Echarts中地图示例
选择Echarts中地图示例,我选择的是这个
2、创建html文件
在resources/templates创建html文件

在html文件中引用 js 文件

通过jQuery获取接口数据,完整代码如下:
<div id="main" style="width:1620px; height:750px;"></div>
<script type="text/javascript">
window.onload = function citys() {
// 基于准备好的dom,初始化echarts实例
var myChart = echarts.init(document.getElementById('main'));
myChart.showLoading(); //数据加载完之前先显示一段简单的loading动画
//声明一个对象
var citylist = [];
var nus = [];
$.ajax({
async: true, //异步请求
data: {},
//请求方式get
type: "GET",
//请求地址
url: "/city/list",
//数据,json字符串
dataType: "json",
//请求成功
success: function (result) {
console.log(result);
//进行数据的遍历
$.each(result, function (index, item) {
citylist.push(item.city);
// 格式化对象
nus.push({
name: item.city,
value: item.count
});
});
console.log(citylist);
console.log(nus);
myChart.hideLoading(); //隐藏加载动画
var data = nus; // 城市的数据
// 地理坐标
var geoCoordMap = {
海门: [121.15, 31.89],
鄂尔多斯: [109.781327, 39.608266],
招远: [120.38, 37.35],
舟山: [122.207216, 29.985295],
齐齐哈尔: [123.97, 47.33],
盐城: [120.13, 33.38],
赤峰: [118.87, 42.28],
青岛: [120.33, 36.07],
乳山: [121.52, 36.89],
金昌: [102.188043, 38.520089],
泉州: [118.58, 24.93],
莱西: [120.53, 36.86],
日照: [119.46, 35.42],
胶南: [119.97, 35.88],
南通: [121.05, 32.08],
拉萨: [91.11, 29.97],
云浮: [112.02, 22.93],
梅州: [116.1, 24.55],
文登: [122.05, 37.2],
上海: [121.48, 31.22],
攀枝花: [101.718637, 26.582347],
威海: [122.1, 37.5],
承德: [117.93, 40.97],
厦门: [118.1, 24.46],
汕尾: [115.375279, 22.786211],
潮州: [116.63, 23.68],
丹东: [124.37, 40.13],
太仓: [121.1, 31.45],
曲靖: [103.79, 25.51],
烟台: [121.39, 37.52],
福州: [119.3, 26.08],
瓦房店: [121.979603, 39.627114],
即墨: [120.45, 36.38],
抚顺: [123.97, 41.97],
玉溪: [102.52, 24.35],
张家口: [114.87, 40.82],
阳泉: [113.57, 37.85],
莱州: [119.942327, 37.177017],
湖州: [120.1, 30.86],
汕头: [116.69, 23.39],
昆山: [120.95, 31.39],
宁波: [121.56, 29.86],
湛江: [110.359377, 21.270708],
揭阳: [116.35, 23.55],
荣成: [122.41, 37.16],
连云港: [119.16, 34.59],
葫芦岛: [120.836932, 40.711052],
常熟: [120.74, 31.64],
东莞: [113.75, 23.04],
河源: [114.68, 23.73],
淮安: [119.15, 33.5],
泰州: [119.9, 32.49],
南宁: [108.33, 22.84],
营口: [122.18, 40.65],
惠州: [114.4, 23.09],
江阴: [120.26, 31.91],
蓬莱: [120.75, 37.8],
韶关: [113.62, 24.84],
嘉峪关: [98.289152, 39.77313],
广州: [113.23, 23.16],
延安: [109.47, 36.6],
太原: [112.53, 37.87],
清远: [113.01, 23.7],
中山: [113.38, 22.52],
昆明: [102.73, 25.04],
寿光: [118.73, 36.86],
盘锦: [122.070714, 41.119997],
长治: [113.08, 36.18],
深圳: [114.07, 22.62],
珠海: [113.52, 22.3],
宿迁: [118.3, 33.96],
咸阳: [108.72, 34.36],
铜川: [109.11, 35.09],
平度: [119.97, 36.77],
佛山: [113.11, 23.05],
海口: [110.35, 20.02],
江门: [113.06, 22.61],
章丘: [117.53, 36.72],
肇庆: [112.44, 23.05],
大连: [121.62, 38.92],
临汾: [111.5, 36.08],
吴江: [120.63, 31.16],
石嘴山: [106.39, 39.04],
沈阳: [123.38, 41.8],
苏州: [120.62, 31.32],
茂名: [110.88, 21.68],
嘉兴: [120.76, 30.77],
长春: [125.35, 43.88],
胶州: [120.03336, 36.264622],
银川: [106.27, 38.47],
张家港: [120.555821, 31.875428],
三门峡: [111.19, 34.76],
锦州: [121.15, 41.13],
南昌: [115.89, 28.68],
柳州: [109.4, 24.33],
三亚: [109.511909, 18.252847],
自贡: [104.778442, 29.33903],
吉林: [126.57, 43.87],
阳江: [111.95, 21.85],
泸州: [105.39, 28.91],
西宁: [101.74, 36.56],
宜宾: [104.56, 29.77],
呼和浩特: [111.65, 40.82],
成都: [104.06, 30.67],
大同: [113.3, 40.12],
镇江: [119.44, 32.2],
桂林: [110.28, 25.29],
张家界: [110.479191, 29.117096],
宜兴: [119.82, 31.36],
北海: [109.12, 21.49],
西安: [108.95, 34.27],
金坛: [119.56, 31.74],
东营: [118.49, 37.46],
牡丹江: [129.58, 44.6],
遵义: [106.9, 27.7],
绍兴: [120.58, 30.01],
扬州: [119.42, 32.39],
常州: [119.95, 31.79],
潍坊: [119.1, 36.62],
重庆: [106.54, 29.59],
台州: [121.420757, 28.656386],
南京: [118.78, 32.04],
滨州: [118.03, 37.36],
贵阳: [106.71, 26.57],
无锡: [120.29, 31.59],
本溪: [123.73, 41.3],
克拉玛依: [84.77, 45.59],
渭南: [109.5, 34.52],
马鞍山: [118.48, 31.56],
宝鸡: [107.15, 34.38],
焦作: [113.21, 35.24],
句容: [119.16, 31.95],
北京: [116.46, 39.92],
徐州: [117.2, 34.26],
衡水: [115.72, 37.72],
包头: [110, 40.58],
绵阳: [104.73, 31.48],
乌鲁木齐: [87.68, 43.77],
枣庄: [117.57, 34.86],
杭州: [120.19, 30.26],
淄博: [118.05, 36.78],
鞍山: [122.85, 41.12],
溧阳: [119.48, 31.43],
库尔勒: [86.06, 41.68],
安阳: [114.35, 36.1],
开封: [114.35, 34.79],
济南: [117, 36.65],
德阳: [104.37, 31.13],
温州: [120.65, 28.01],
九江: [115.97, 29.71],
邯郸: [114.47, 36.6],
临安: [119.72, 30.23],
兰州: [103.73, 36.03],
沧州: [116.83, 38.33],
临沂: [118.35, 35.05],
南充: [106.110698, 30.837793],
天津: [117.2, 39.13],
富阳: [119.95, 30.07],
泰安: [117.13, 36.18],
诸暨: [120.23, 29.71],
郑州: [113.65, 34.76],
哈尔滨: [126.63, 45.75],
聊城: [115.97, 36.45],
芜湖: [118.38, 31.33],
唐山: [118.02, 39.63],
平顶山: [113.29, 33.75],
邢台: [114.48, 37.05],
德州: [116.29, 37.45],
济宁: [116.59, 35.38],
荆州: [112.239741, 30.335165],
宜昌: [111.3, 30.7],
义乌: [120.06, 29.32],
丽水: [119.92, 28.45],
洛阳: [112.44, 34.7],
秦皇岛: [119.57, 39.95],
株洲: [113.16, 27.83],
石家庄: [114.48, 38.03],
莱芜: [117.67, 36.19],
常德: [111.69, 29.05],
保定: [115.48, 38.85],
湘潭: [112.91, 27.87],
金华: [119.64, 29.12],
岳阳: [113.09, 29.37],
长沙: [113, 28.21],
衢州: [118.88, 28.97],
廊坊: [116.7, 39.53],
菏泽: [115.480656, 35.23375],
合肥: [117.27, 31.86],
武汉: [114.31, 30.52],
大庆: [125.03, 46.58]
};
var convertData = function (data) { // 遍历传入的data数组。
var res = [];
for (var i = 0; i < data.length; i++) {
var geoCoord = geoCoordMap[data[i].name]; // 城市的名称
if (geoCoord) { // 检查geoCoordMap中是否存在当前城市的数据。
res.push({ // 格式化数据
name: data[i].name,
value: geoCoord.concat(data[i].value)
});
}
}
return res;
};
function renderItem(params, api) { // 渲染坐标信息元素
var coords = [ // 定义一个包含经纬度坐标的数组。
[116.7, 39.53],
[103.73, 36.03],
[112.91, 27.87],
[120.65, 28.01],
[119.57, 39.95]
];
var points = []; // 存储转换后的坐标点
// 将经纬度坐标转换为图表坐标系中的点。
for (var i = 0; i < coords.length; i++) {
points.push(api.coord(coords[i]));
}
var color = api.visual('color'); // 填充颜色
return {
type: 'polygon', // 指定图形类型为 'polygon'(多边形)。
// 定义多边形的形状,即使用前面计算出的 points 数组。
shape: {
points: echarts.graphic.clipPointsByRect(points, {
x: params.coordSys.x,
y: params.coordSys.y,
width: params.coordSys.width,
height: params.coordSys.height
})
},
// 定义多边形的样式,包括填充颜色和描边颜色。
style: api.style({
fill: color,
stroke: echarts.color.lift(color)
})
};
}
var option = {
// 设置整个图表的背景颜色为透明
backgroundColor: 'transparent',
// 配置标题,包括主标题文本、位置和样式
title: {
text: '职位城市分布', // 主标题文本
left: 'center', // 主标题位置设置为居中
textStyle: {
color: '#fff' // 主标题文字颜色设置为白色
}
},
// 配置提示框组件,当鼠标悬停在图表项时显示的提示信息
tooltip: {
trigger: 'item' // 提示框触发方式设置为数据项
},
bmap: {
center: [104.114129, 37.550339], // 地图中心点坐标
zoom: 5, // 地图缩放级别
roam: true, // 是否允许缩放和平移
mapStyle: { // 自定义地图样式
styleJson: [
{
featureType: 'water',
elementType: 'all',
stylers: {
color: '#044161'
}
},
{
featureType: 'land',
elementType: 'all',
stylers: {
color: '#004981'
}
},
{
featureType: 'boundary',
elementType: 'geometry',
stylers: {
color: '#064f85'
}
},
{
featureType: 'railway',
elementType: 'all',
stylers: {
visibility: 'off'
}
},
{
featureType: 'highway',
elementType: 'geometry',
stylers: {
color: '#004981'
}
},
{
featureType: 'highway',
elementType: 'geometry.fill',
stylers: {
color: '#005b96',
lightness: 1
}
},
{
featureType: 'highway',
elementType: 'labels',
stylers: {
visibility: 'off'
}
},
{
featureType: 'arterial',
elementType: 'geometry',
stylers: {
color: '#004981'
}
},
{
featureType: 'arterial',
elementType: 'geometry.fill',
stylers: {
color: '#00508b'
}
},
{
featureType: 'poi',
elementType: 'all',
stylers: {
visibility: 'off'
}
},
{
featureType: 'green',
elementType: 'all',
stylers: {
color: '#056197',
visibility: 'off'
}
},
{
featureType: 'subway',
elementType: 'all',
stylers: {
visibility: 'off'
}
},
{
featureType: 'manmade',
elementType: 'all',
stylers: {
visibility: 'off'
}
},
{
featureType: 'local',
elementType: 'all',
stylers: {
visibility: 'off'
}
},
{
featureType: 'arterial',
elementType: 'labels',
stylers: {
visibility: 'off'
}
},
{
featureType: 'boundary',
elementType: 'geometry.fill',
stylers: {
color: '#029fd4'
}
},
{
featureType: 'building',
elementType: 'all',
stylers: {
color: '#1a5787'
}
},
{
featureType: 'label',
elementType: 'all',
stylers: {
visibility: 'off'
}
}
]
}
},
series: [
{
// 定义一个散点图系列
name: 'pm2.5', // 系列名称
type: 'scatter', // 图表类型为散点图
coordinateSystem: 'bmap', // 指定使用的坐标系为百度地图
data: convertData(data), // 使用转换后的数据
encode: { // 定义数据编码,value: 2 表示数据值作为散点图的 z 轴值
value: 2
},
symbolSize: function (val) { // 定义散点大小的回调函数
return val[2] / 10;
},
label: {
formatter: '{b}', // 标签格式化器,显示数据名称
position: 'right', // 标签位置为右侧
},
itemStyle: {
color: '#ddb926' // 数据项样式的颜色
},
emphasis: {
label: {
show: true, // 高亮状态下标签是否显示
}
}
},
{
// 图表类型,这里是 effectScatter,表示带有特效的散点图
type: 'effectScatter',
// 指定坐标系类型,这里是 'bmap',表示使用百度地图作为坐标系
coordinateSystem: 'bmap',
data: convertData(data),
// 编码,定义如何将数据字段映射到图形的属性上
encode: {
value: 2 // 表示将数据项的 value 属性映射到散点图的 z 轴上
},
// 自定义数据点的大小
symbolSize: function (val) {
return val[2] / 10; // 根据数据值的大小调整散点的大小
},
// 设置波动效果一直显示
showEffectOn: 'render',
rippleEffect: {
brushType: 'stroke',
scale: 6, // 控制波动的缩放比例
period: 5 // 控制波动周期,值越大,波动越慢
},
// 是否启用鼠标悬停动画
hoverAnimation: true,
// 标签的配置
label: {
formatter: '{b}', // 标签内容的格式化器,'{b}' 表示显示数据项的名称
position: 'right', // 标签的位置在数据点的右侧
show: true, // 是否显示标签
textStyle: {
// 修改标签文本颜色为红色,您可以根据需要选择颜色
color: '#F7F7F7',
// 如果需要,您可以保留字体大小和加粗样式,或者添加其他样式
fontSize: 12,
fontWeight: 'bold',
fontFamily: 'Arial, sans-serif'
}
},
// 数据项样式的配置
itemStyle: {
color: '#f4e925', // 数据点的颜色
shadowBlur: 10, // 阴影的模糊度
shadowColor: '#333' // 阴影的颜色
},
// z 层级,用于控制图形的堆叠顺序
zlevel: 1
},
]
};
// 使用 setOption 方法加载数据和配置项
myChart.setOption(option);
},
error: function (errorMsg) {
//请求失败时执行该函数
alert("图表请求数据失败!");
myChart.hideLoading();
}
});
};
</script>
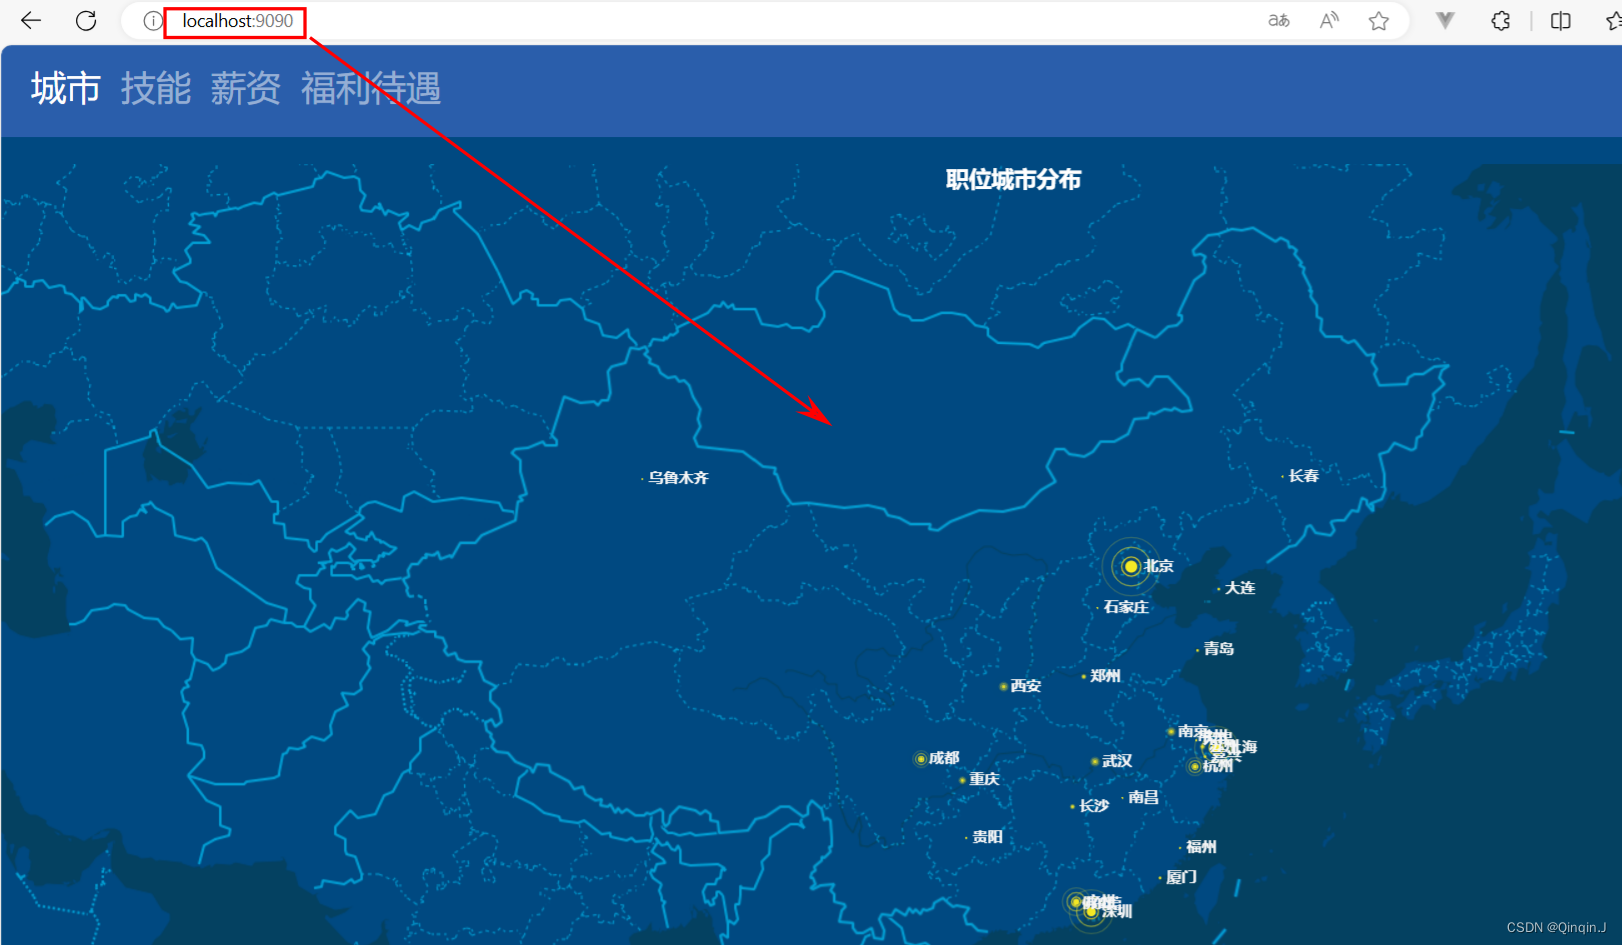
3、结果
访问端口
http://localhost:9090/
本文转载自: https://blog.csdn.net/2202_75688394/article/details/139391384
版权归原作者 Qinqin.J 所有, 如有侵权,请联系我们删除。
版权归原作者 Qinqin.J 所有, 如有侵权,请联系我们删除。