
简介
skywalking是一个优秀的国产开源框架,2015年由个人吴晟(华为开发者)开源 , 2017年加入Apache孵化器。短短两年就被Apache收入麾下,实力可见一斑。 skywalking支持dubbo,SpringCloud,SpringBoot集成,代码无侵入,通信方式采用GRPC,性能较好,实现方式是java探针,支持告警,支持JVM监控,支持全局调用统计等等,功能较完善。
官网:https://skywalking.apache.org/
Skywalking架构
SkyWalking 逻辑上分为四部分: 探针, 平台后端, 存储和用户界面。
- 探针 基于不同的来源可能是不一样的, 但作用都是收集数据, 将数据格式化为 SkyWalking 适用的格式.
- 平台后端, 支持数据聚合, 数据分析以及驱动数据流从探针到用户界面的流程。分析包括 Skywalking 原生追踪和性能指标以及第三方来源,包括 Istio 及 Envoy telemetry , Zipkin 追踪格式化等。
- 存储 通过开放的插件化的接口存放 SkyWalking 数据. 你可以选择一个既有的存储系统, 如 ElasticSearch, H2 或 MySQL 集群(Sharding-Sphere 管理),也可以选择自己实现一个存储系统. 当然, 我们非常欢迎你贡献新的存储系统实现。
- UI 一个基于接口高度定制化的Web系统,用户可以可视化查看和管理 SkyWalking 数据。
部署安装
多种方式,只给出docker部署的docker-compose例子,其他的自行在官网查找。
存储使用的是es7,同时将oap注册到了nacos
version:'2'services:elasticsearch:image: elasticsearch:7.14.2
    container_name: elasticsearch
    restart: always
    ports:- 9200:9200environment:-"TAKE_FILE_OWNERSHIP=true"# volumes 挂载权限 如果不想要挂载es文件改配置可以删除-"discovery.type=single-node"#单机模式启动-"TZ=Asia/Shanghai"# 设置时区-"ES_JAVA_OPTS=-Xms512m -Xmx512m"# 设置jvm内存大小volumes:- /data/skywalking/elasticsearch/logs:/usr/share/elasticsearch/logs
      - /data/skywalking/elasticsearch/data:/usr/share/elasticsearch/data
    ulimits:memlock:soft:-1hard:-1skywalking-oap-server:image: apache/skywalking-oap-server:8.9.1
    container_name: skywalking-oap-server
    depends_on:- elasticsearch
    links:- elasticsearch
    restart: always
    ports:- 11800:11800- 12800:12800environment:#此处的参数为容器里/skywalking/config/application.yml的配置SW_STORAGE: elasticsearch  # 指定ES版本SW_STORAGE_ES_CLUSTER_NODES: elasticsearch:9200SW_CLUSTER: nacos
      SW_SERVICE_NAME: skywalking-oap-server
      SW_CLUSTER_NACOS_HOST_PORT: 192.168.0.200
      SW_CLUSTER_NACOS_NAMESPACE: dev
      TZ: Asia/Shanghai
  skywalking-ui:image: apache/skywalking-ui:8.9.1
    container_name: skywalking-ui
    depends_on:- skywalking-oap-server
    links:- skywalking-oap-server
    restart: always
    ports:- 8080:8080environment:SW_OAP_ADDRESS: http://skywalking-oap-server:12800TZ: Asia/Shanghai
UI界面说明
- 仪表盘:查看被监控服务的运行状态
- 拓扑图:以拓扑图的方式展现服务直接的关系,并以此为入口查看相关信息
- 追踪:以接口列表的方式展现,追踪接口内部调用过程
- 性能剖析:单独端点进行采样分析,并可查看堆栈信息
- 告警:触发告警的告警列表,包括实例,请求超时等。
- 事件:
- 调试:
仪表盘
仪表盘分为:全局(Global)、服务(Service)、实例(Instance)、端点(Endpoint)四个维度
- Global全局维度

- Services load:服务每分钟请求数
- Slow Services:慢响应服务,单位ms
- Un-Health services(Apdex):Apdex性能指标,1为满分。
- Global Response Latency:百分比响应延时,不同百分比的延时时间,单位ms
- Global Heatmap:服务响应时间热力分布图,根据时间段内不同响应时间的数量显示颜色深度
- Service服务维度
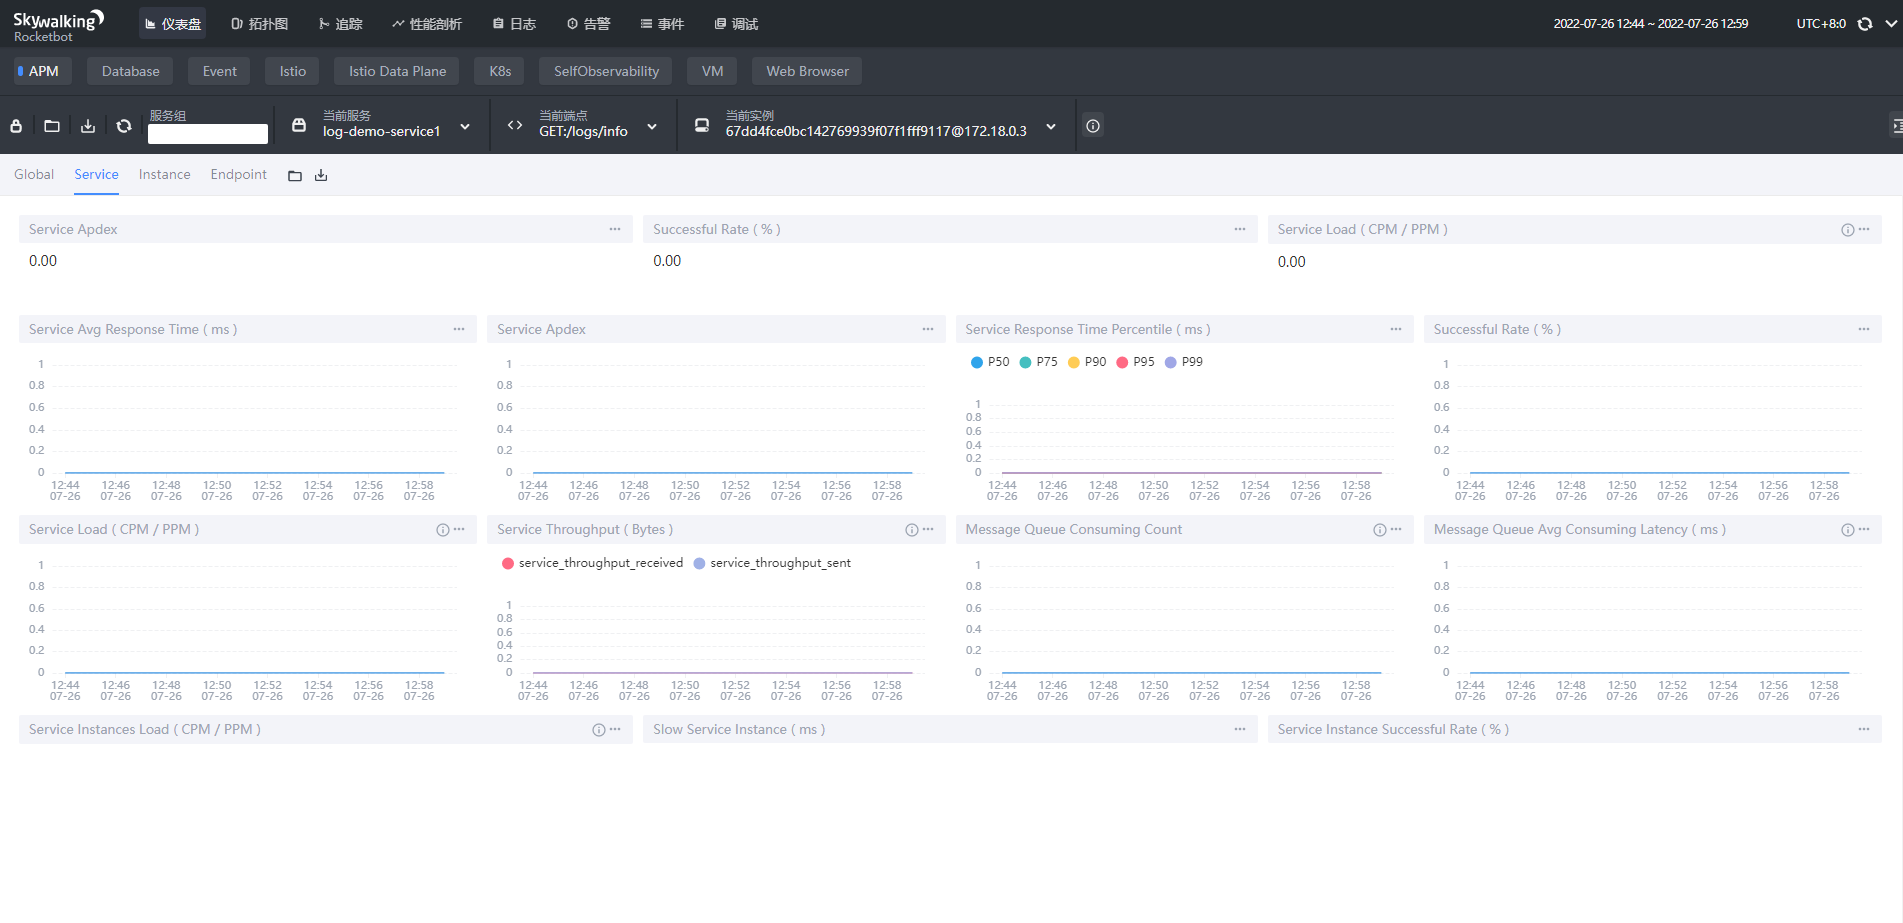
- Service Apdex(数字):当前服务的评分
- Service Apdex(折线图):不同时间的Apdex评分
- Successful Rate(数字):请求成功率
- Successful Rate(折线图):不同时间的请求成功率
- Servce Load(数字):每分钟请求数
- Servce Load(折线图):不同时间的每分钟请求数
- Service Avg Response Times:平均响应延时,单位ms
- Global Response Time Percentile:百分比响应延时
- Servce Instances Load:每个服务实例的每分钟请求数
- Show Service Instance:每个服务实例的最大延时
- Service Instance Successful Rate:每个服务实例的请求成功率
- Instance实例维度
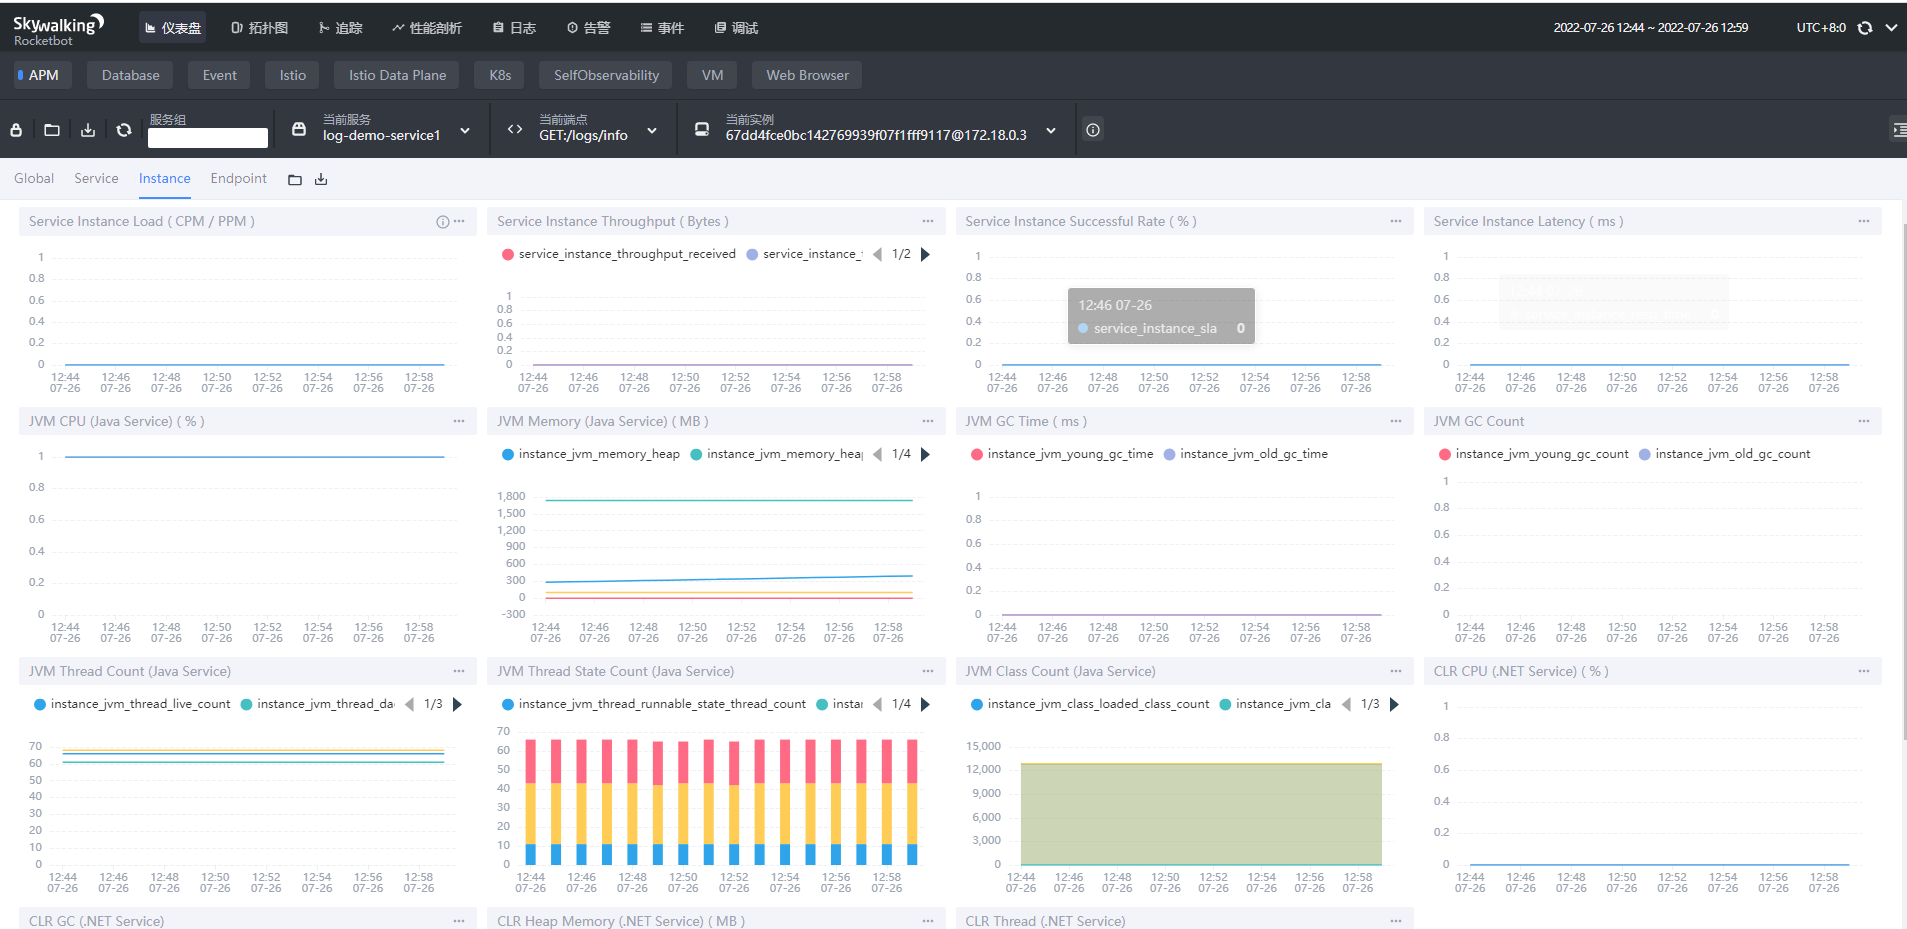
- Service Instance Load:当前实例的每分钟请求数
- Service Instance Successful Rate:当前实例的请求成功率
- Service Instance Latency:当前实例的响应延时
- JVM CPU:jvm占用CPU的百分比
- JVM Memory:JVM内存占用大小,单位m
- JVM GC Time:JVM垃圾回收时间,包含YGC和OGC
- JVM GC Count:JVM垃圾回收次数,包含YGC和OGC
- CLR XX:类似JVM虚拟机,这里用不上就不做解释了
- Endpoint端点维度
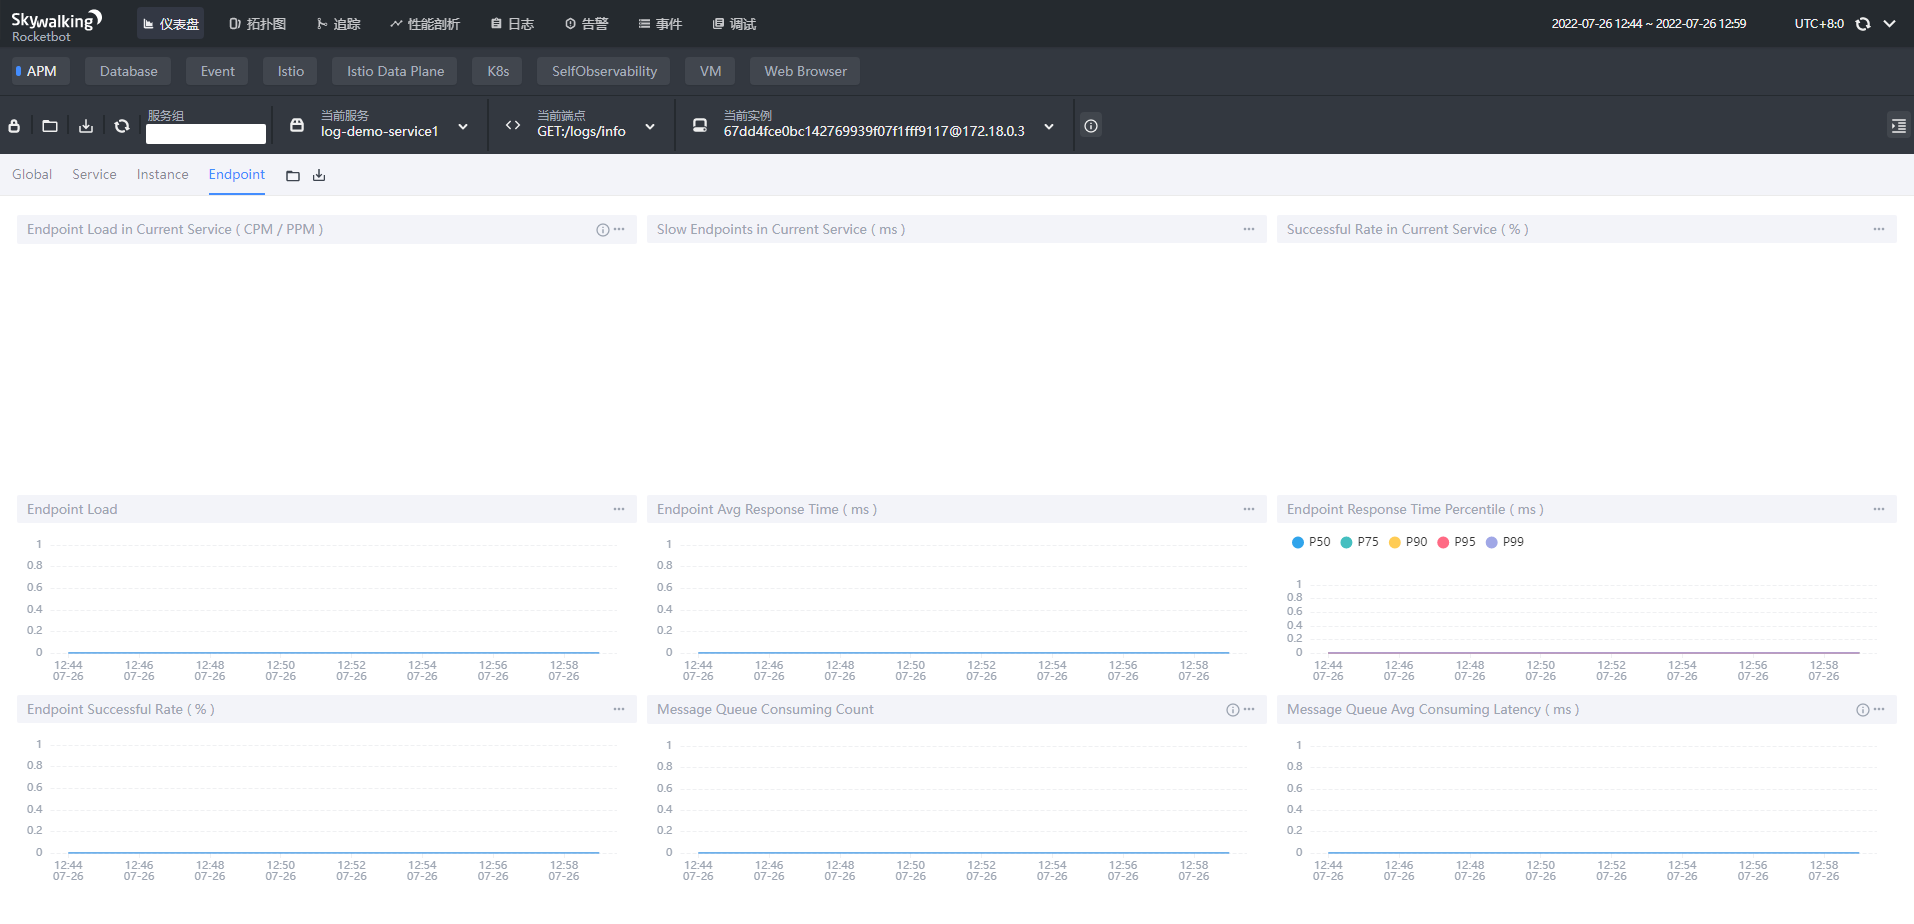
- Endpoint Load in Current Service:每个端点的每分钟请求数
- Slow Endpoints in Current Service:每个端点的最慢请求时间,单位ms
- Successful Rate in Current Service:每个端点的请求成功率
- Endpoint Load:当前端点每个时间段的请求数据
- Endpoint Avg Response Time:当前端点每个时间段的请求行响应时间
- Endpoint Response Time Percentile:当前端点每个时间段的响应时间占比
- Endpoint Successful Rate:当前端点每个时间段的请求成功率
界面上的指标可以做一些自定义的调整(更换图表、统计数量等),也可以增加自定义指标(应该是要二开)

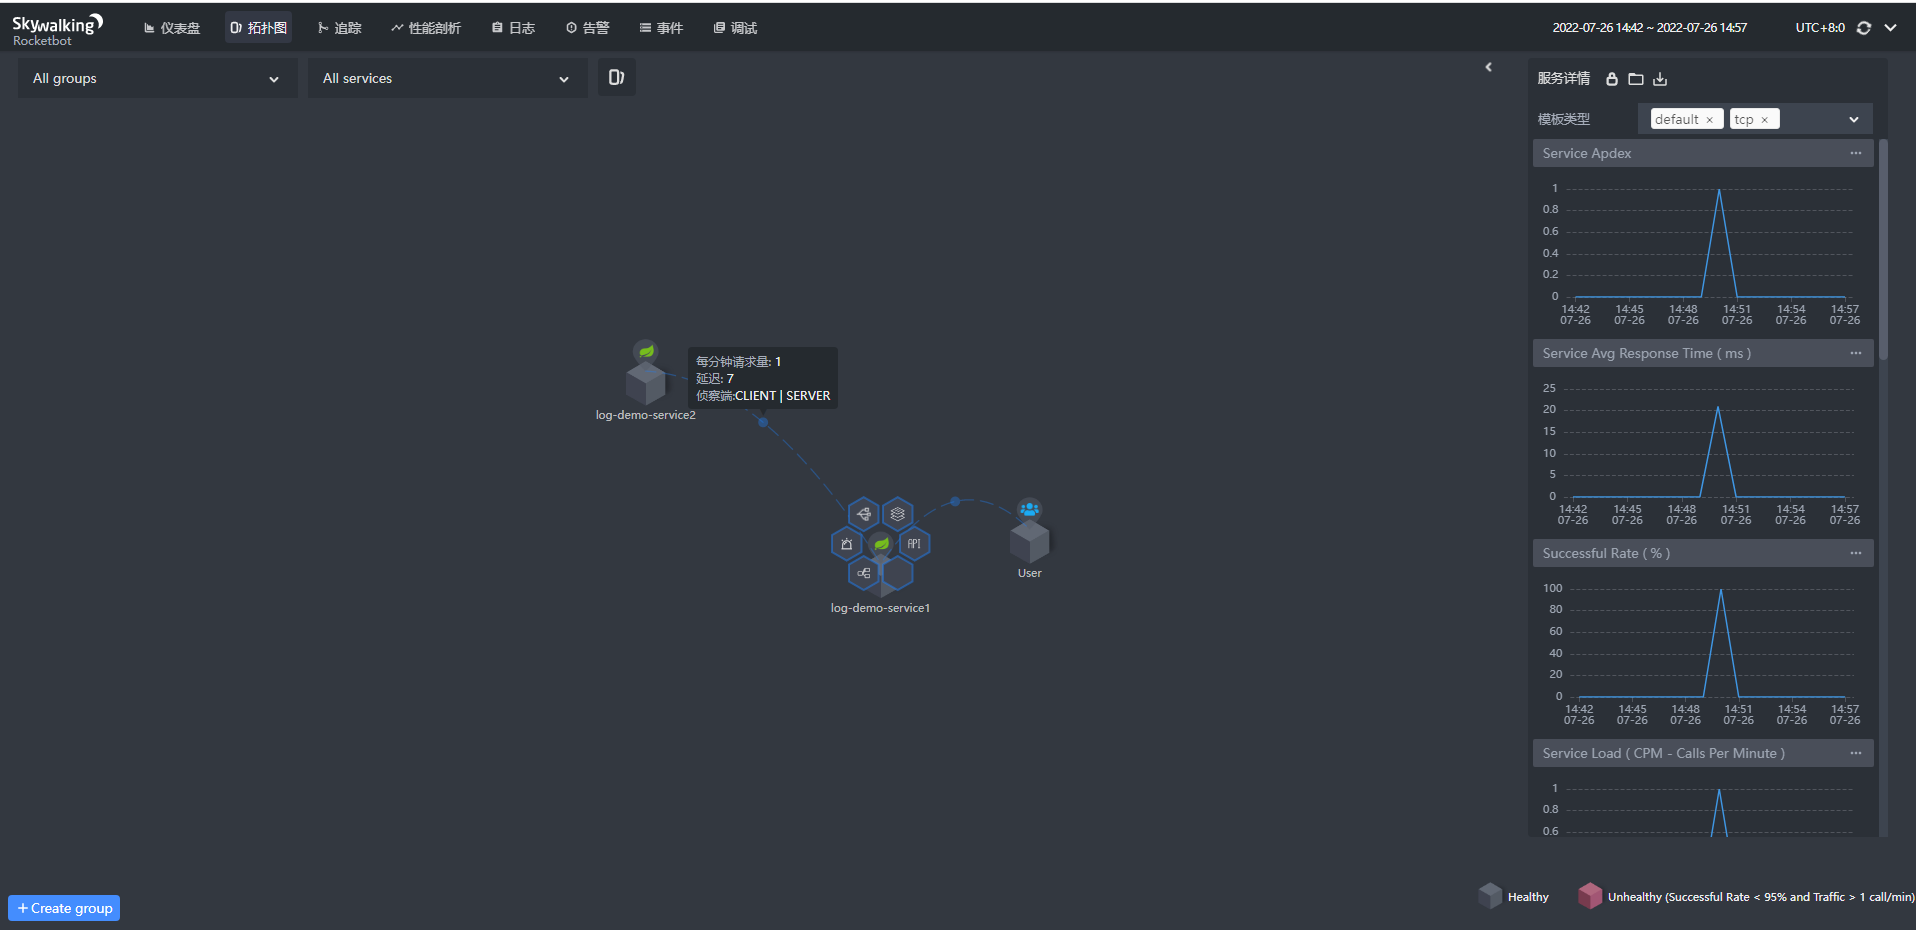
拓扑图

点击具体的服务,右侧将显示服务的状态,服务周边出现触点;点击连线,将会显示服务之间的连接情况
追踪
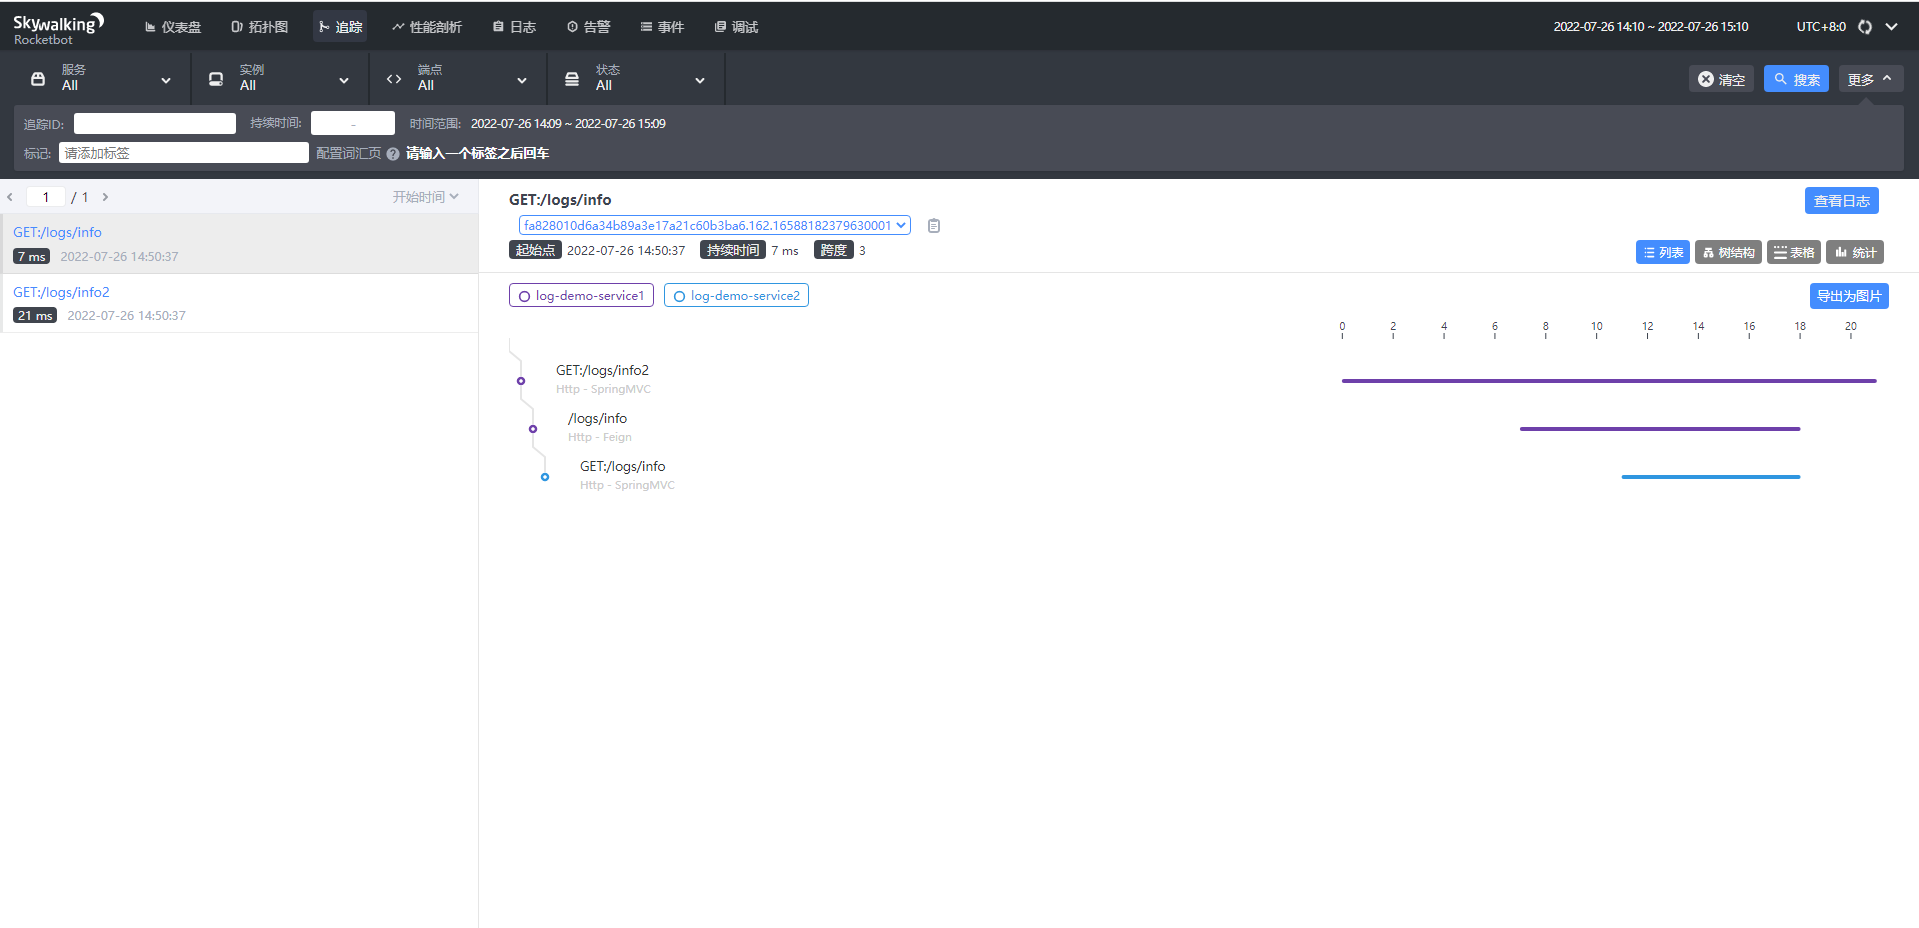
- 左侧:api接口列表,红色-异常请求,蓝色-正常请求
- 右侧:api追踪列表,api请求连接各端点的先后顺序和时间
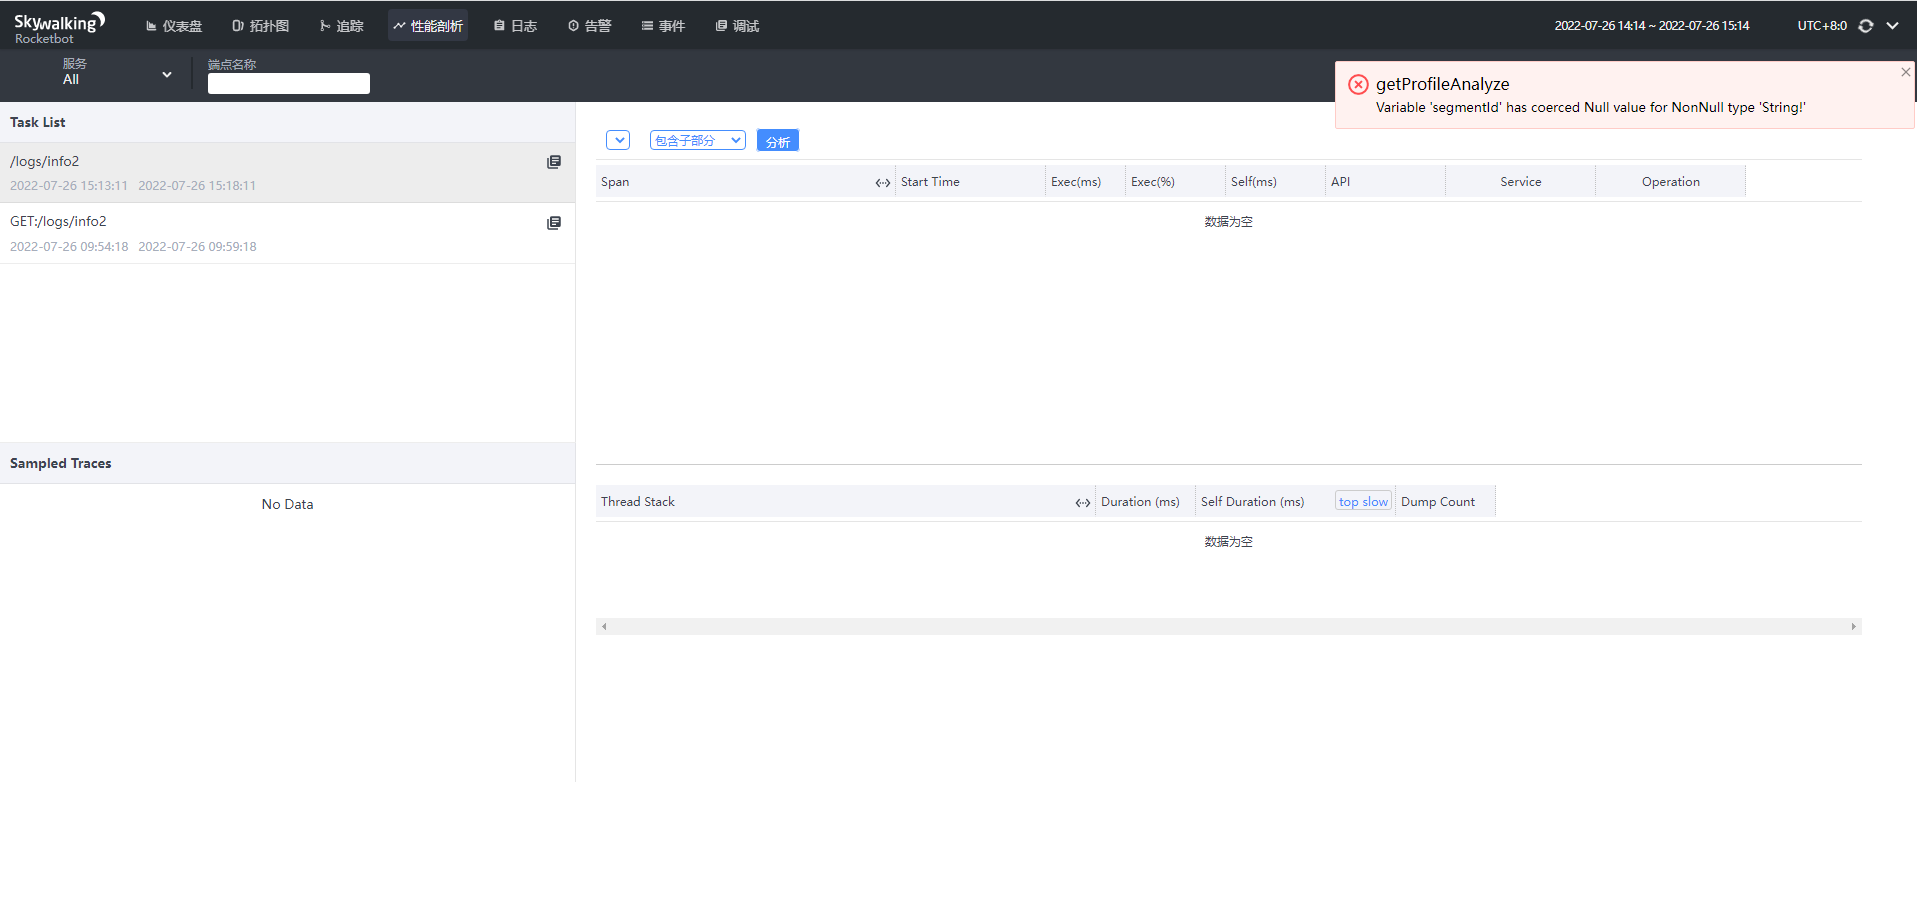
性能剖析
会报错,暂时不知道怎么用
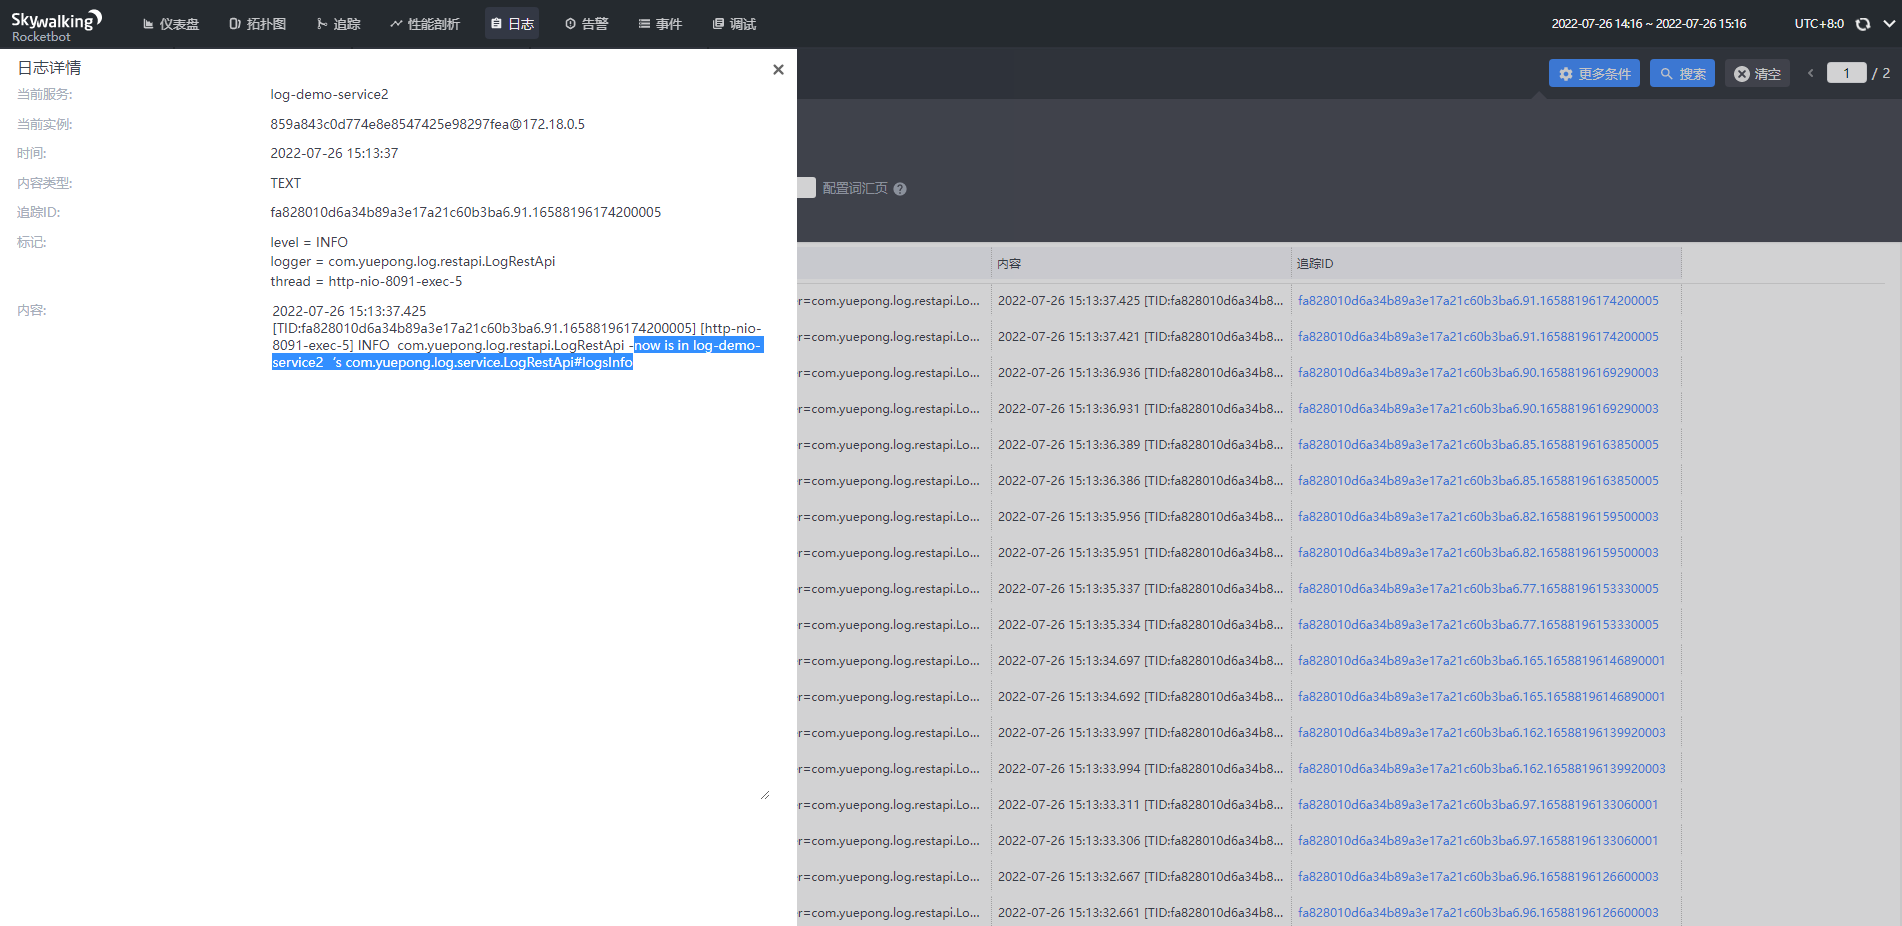
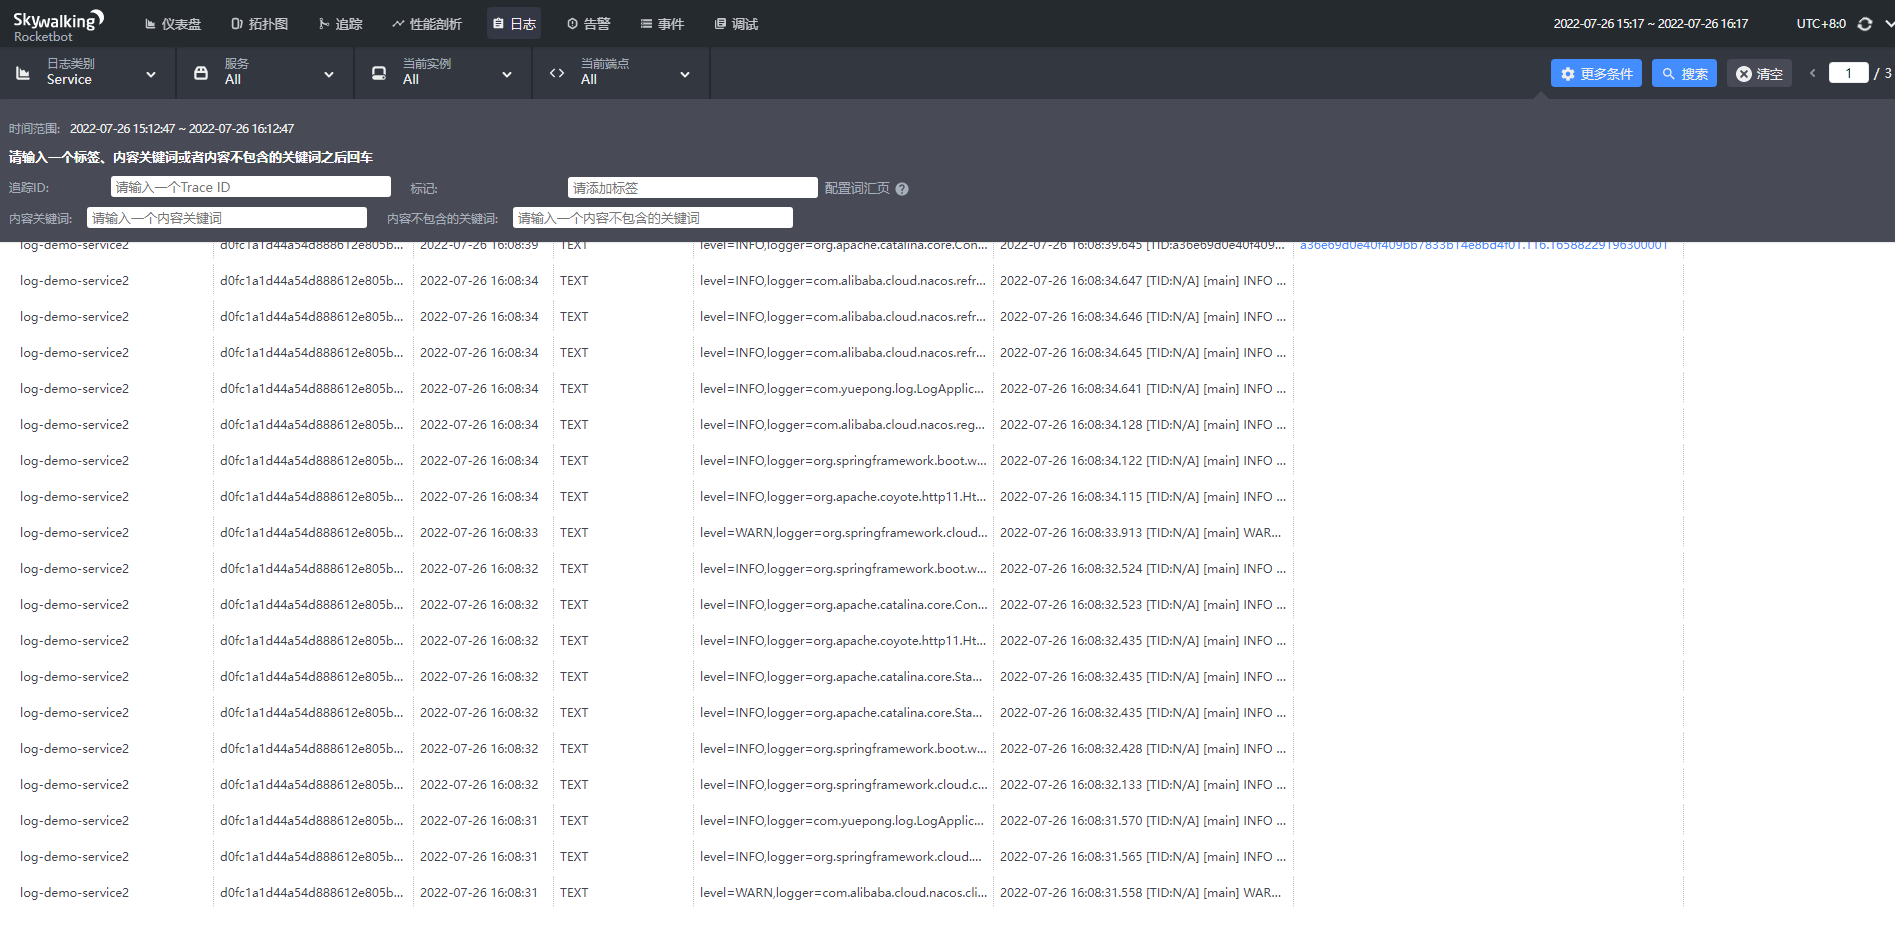
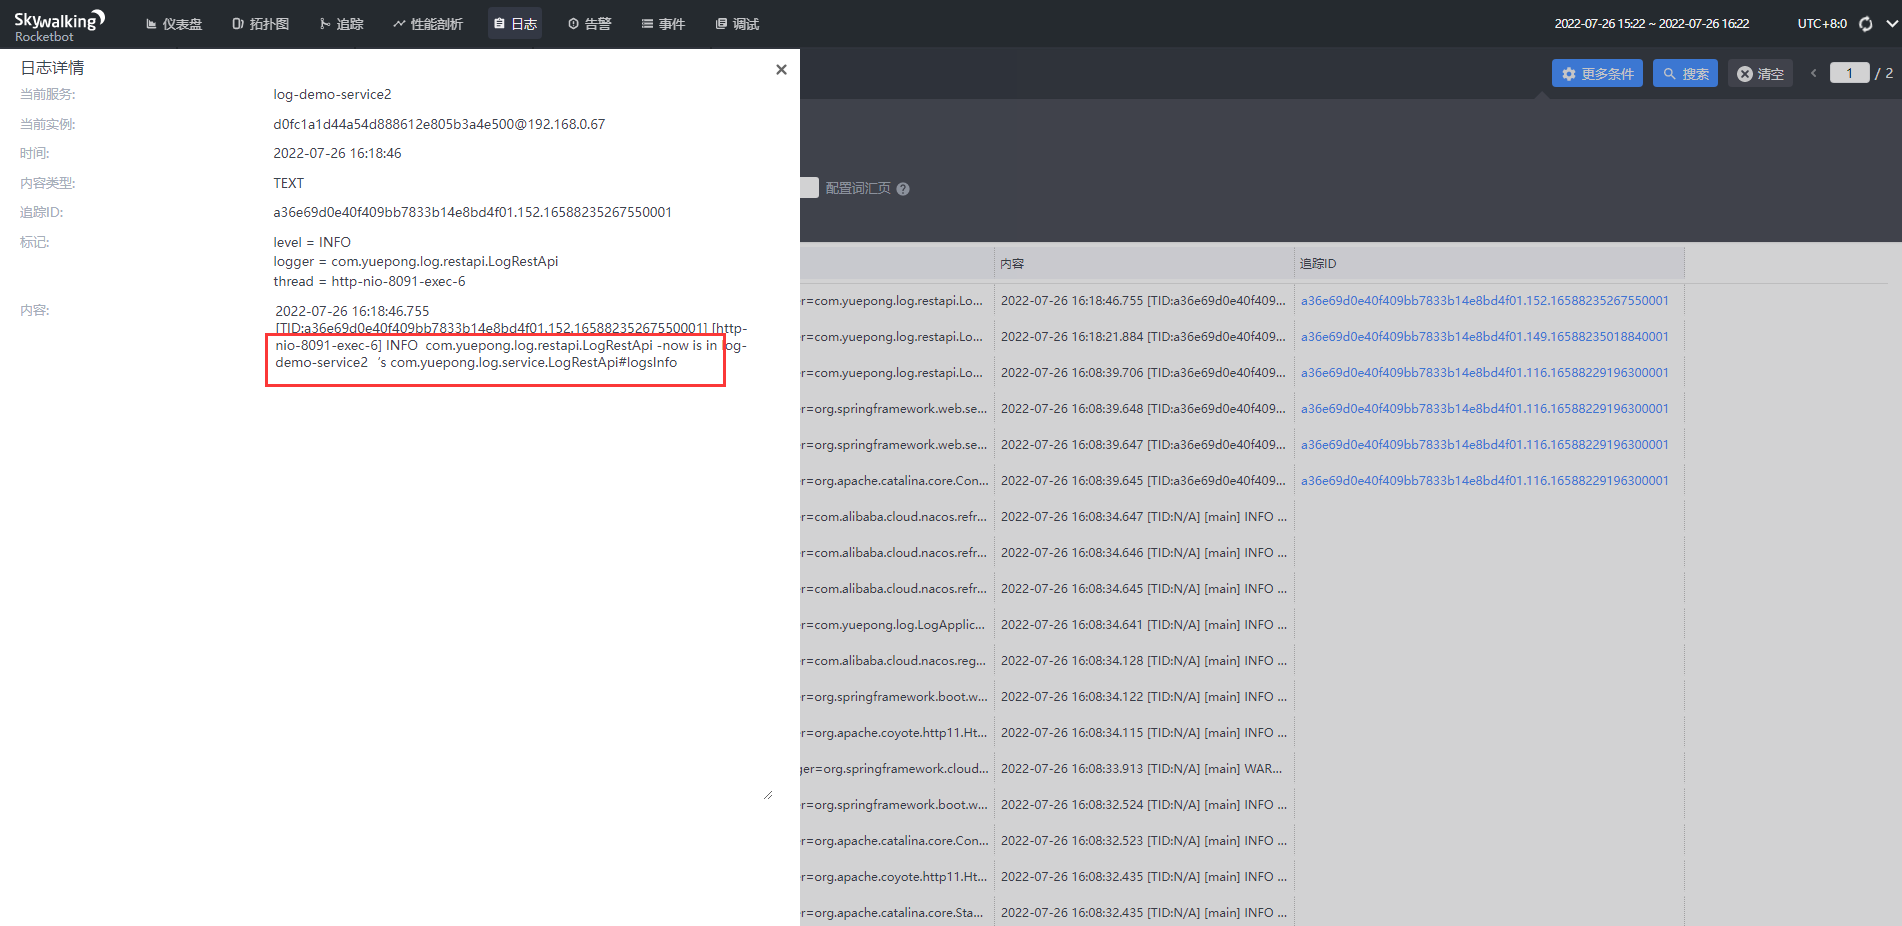
日志
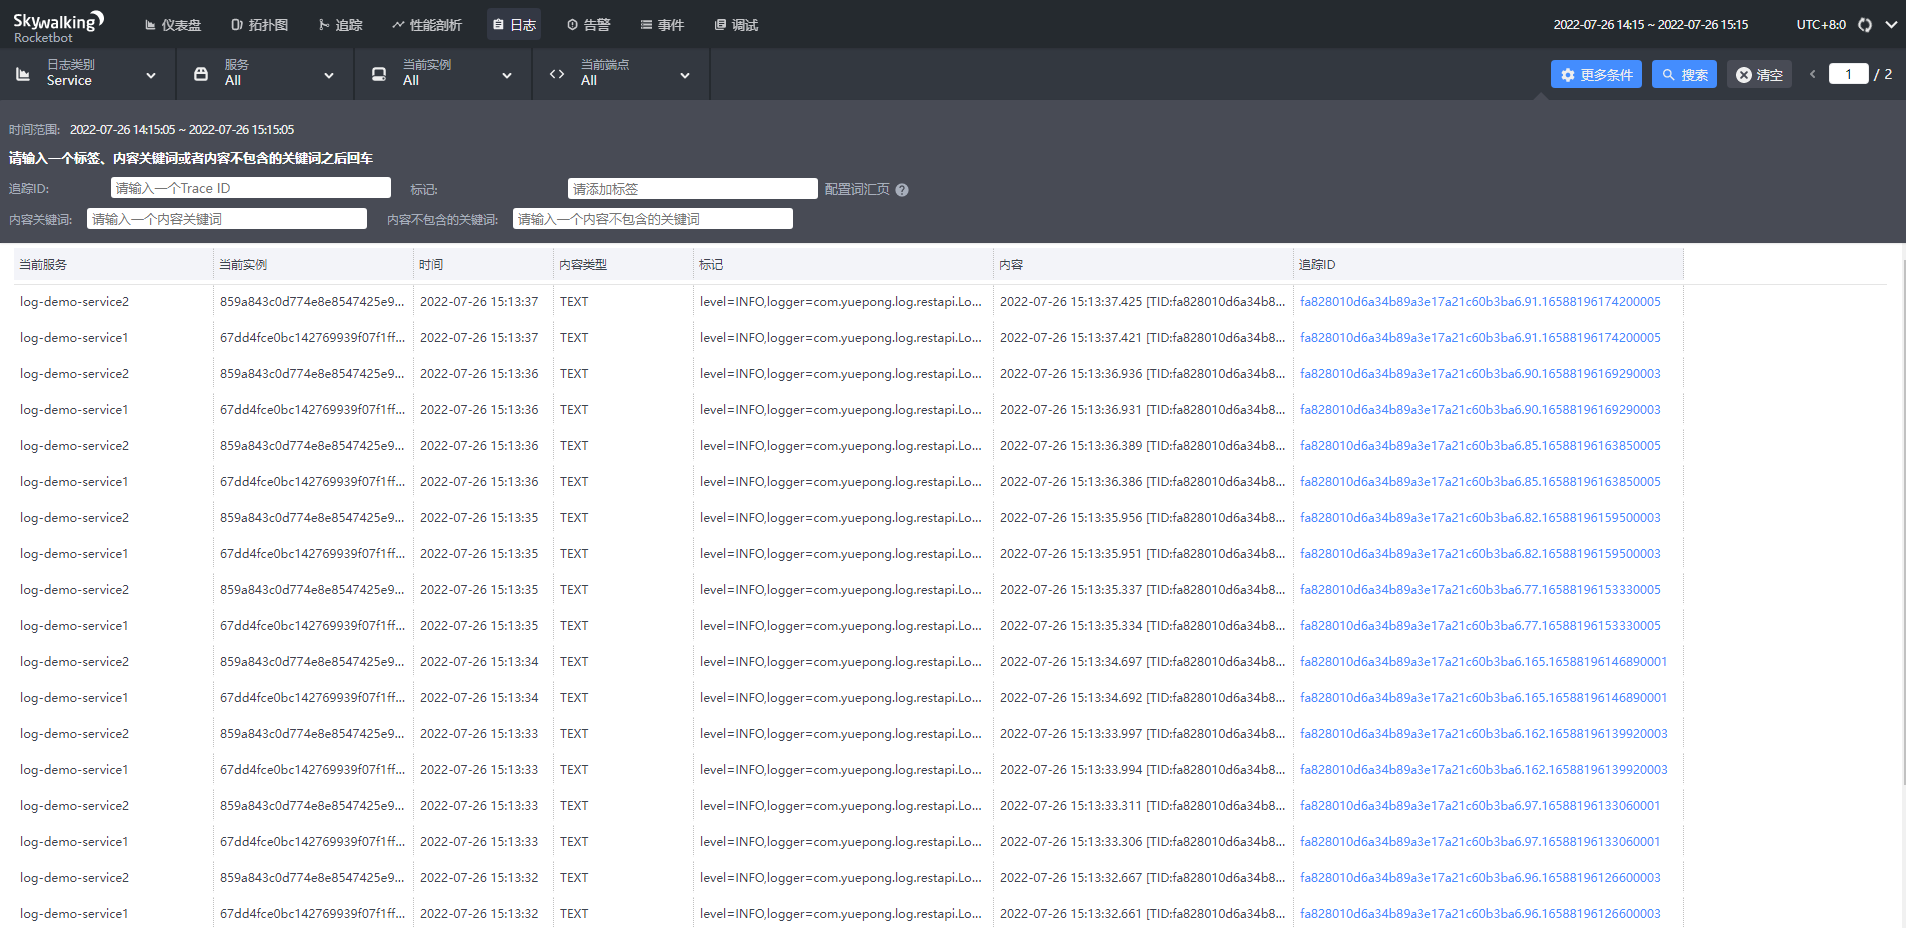
点击可查看具体的日志,同一追踪id表明是同一个请求
告警
对于服务的异常信息,比如接口有较长延迟,skywalking也做出了告警功能,如下图:
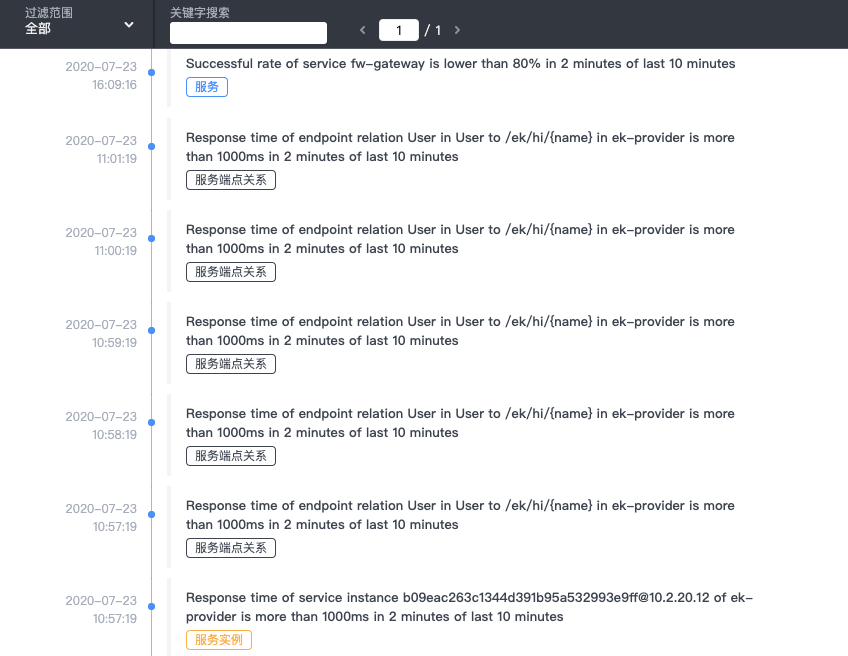
skywalking中有一些默认的告警规则,如下:
- 最近3分钟内服务的平均响应时间超过1秒
- 最近2分钟服务成功率低于80%
- 最近3分钟90%服务响应时间超过1秒
- 最近2分钟内服务实例的平均响应时间超过1秒
当然除了以上四种,随着Skywalking不断迭代也会新增其他规则,这些规则的配置在
config/alarm-settings.yml
配置文件中
# Licensed to the Apache Software Foundation (ASF) under one# or more contributor license agreements.  See the NOTICE file# distributed with this work for additional information# regarding copyright ownership.  The ASF licenses this file# to you under the Apache License, Version 2.0 (the# "License"); you may not use this file except in compliance# with the License.  You may obtain a copy of the License at##     http://www.apache.org/licenses/LICENSE-2.0## Unless required by applicable law or agreed to in writing, software# distributed under the License is distributed on an "AS IS" BASIS,# WITHOUT WARRANTIES OR CONDITIONS OF ANY KIND, either express or implied.# See the License for the specific language governing permissions and# limitations under the License.# Sample alarm rules.rules:# Rule unique name, must be ended with `_rule`.service_resp_time_rule:metrics-name: service_resp_time
    op:">"threshold:1000period:10count:3silence-period:5message: Response time of service {name} is more than 1000ms in 3 minutes of last 10 minutes.
  service_sla_rule:# Metrics value need to be long, double or intmetrics-name: service_sla
    op:"<"threshold:8000# The length of time to evaluate the metricsperiod:10# How many times after the metrics match the condition, will trigger alarmcount:2# How many times of checks, the alarm keeps silence after alarm triggered, default as same as period.silence-period:3message: Successful rate of service {name} is lower than 80% in 2 minutes of last 10 minutes
  service_resp_time_percentile_rule:# Metrics value need to be long, double or intmetrics-name: service_percentile
    op:">"threshold:1000,1000,1000,1000,1000period:10count:3silence-period:5message: Percentile response time of service {name} alarm in 3 minutes of last 10 minutes, due to more than one condition of p50 > 1000, p75 > 1000, p90 > 1000, p95 > 1000, p99 > 1000
  service_instance_resp_time_rule:metrics-name: service_instance_resp_time
    op:">"threshold:1000period:10count:2silence-period:5message: Response time of service instance {name} is more than 1000ms in 2 minutes of last 10 minutes
  database_access_resp_time_rule:metrics-name: database_access_resp_time
    threshold:1000op:">"period:10count:2message: Response time of database access {name} is more than 1000ms in 2 minutes of last 10 minutes
  endpoint_relation_resp_time_rule:metrics-name: endpoint_relation_resp_time
    threshold:1000op:">"period:10count:2message: Response time of endpoint relation {name} is more than 1000ms in 2 minutes of last 10 minutes

#  Active endpoint related metrics alarm will cost more memory than service and service instance metrics alarm.#  Because the number of endpoint is much more than service and instance.##  endpoint_avg_rule:#    metrics-name: endpoint_avg#    op: ">"#    threshold: 1000#    period: 10#    count: 2#    silence-period: 5#    message: Response time of endpoint {name} is more than 1000ms in 2 minutes of last 10 minuteswebhooks:#  - http://127.0.0.1/notify/#  - http://127.0.0.1/go-wechat/
规则中的参数属性解释
Rule name。在告警信息中显示的唯一名称。必须以_rule结尾。规则命名用户自定义
属性含义metrics-nameoal脚本中的度量名称 ,不能随便定义threshold阈值,与metrics-name和下面的比较符号相匹配op比较操作符,可以设定>,<,=period多久检查一次当前的指标数据是否符合告警规则,单位分钟count达到多少次后,发送告警消息silence-period在多久之内,忽略相同的告警消息message告警消息内容include-names本规则告警生效的服务列表
metrics-name是oal脚本中的度量名。详细参数可见\config\oal\core.oal文件:
/*
 * Licensed to the Apache Software Foundation (ASF) under one or more
 * contributor license agreements.  See the NOTICE file distributed with
 * this work for additional information regarding copyright ownership.
 * The ASF licenses this file to You under the Apache License, Version 2.0
 * (the "License"); you may not use this file except in compliance with
 * the License.  You may obtain a copy of the License at
 *
 *     http://www.apache.org/licenses/LICENSE-2.0
 *
 * Unless required by applicable law or agreed to in writing, software
 * distributed under the License is distributed on an "AS IS" BASIS,
 * WITHOUT WARRANTIES OR CONDITIONS OF ANY KIND, either express or implied.
 * See the License for the specific language governing permissions and
 * limitations under the License.
 *
 */

// For services using protocols HTTP 1/2, gRPC, RPC, etc., the cpm metrics means "calls per minute",
// for services that are built on top of TCP, the cpm means "packages per minute".

// All scope metrics
all_percentile = from(All.latency).percentile(10);  // Multiple values including p50, p75, p90, p95, p99
all_heatmap = from(All.latency).histogram(100, 20);

// Service scope metrics
service_resp_time = from(Service.latency).longAvg();
service_sla = from(Service.*).percent(status == true);
service_cpm = from(Service.*).cpm();
service_percentile = from(Service.latency).percentile(10); // Multiple values including p50, p75, p90, p95, p99
service_apdex = from(Service.latency).apdex(name, status);
service_mq_consume_count = from(Service.*).filter(type == RequestType.MQ).count();
service_mq_consume_latency = from((str->long)Service.tag["transmission.latency"]).filter(type == RequestType.MQ).filter(tag["transmission.latency"] != null).longAvg();

// Service relation scope metrics for topology
service_relation_client_cpm = from(ServiceRelation.*).filter(detectPoint == DetectPoint.CLIENT).cpm();
service_relation_server_cpm = from(ServiceRelation.*).filter(detectPoint == DetectPoint.SERVER).cpm();
service_relation_client_call_sla = from(ServiceRelation.*).filter(detectPoint == DetectPoint.CLIENT).percent(status == true);
service_relation_server_call_sla = from(ServiceRelation.*).filter(detectPoint == DetectPoint.SERVER).percent(status == true);
service_relation_client_resp_time = from(ServiceRelation.latency).filter(detectPoint == DetectPoint.CLIENT).longAvg();
service_relation_server_resp_time = from(ServiceRelation.latency).filter(detectPoint == DetectPoint.SERVER).longAvg();
service_relation_client_percentile = from(ServiceRelation.latency).filter(detectPoint == DetectPoint.CLIENT).percentile(10); // Multiple values including p50, p75, p90, p95, p99
service_relation_server_percentile = from(ServiceRelation.latency).filter(detectPoint == DetectPoint.SERVER).percentile(10); // Multiple values including p50, p75, p90, p95, p99

// Service Instance relation scope metrics for topology
service_instance_relation_client_cpm = from(ServiceInstanceRelation.*).filter(detectPoint == DetectPoint.CLIENT).cpm();
service_instance_relation_server_cpm = from(ServiceInstanceRelation.*).filter(detectPoint == DetectPoint.SERVER).cpm();
service_instance_relation_client_call_sla = from(ServiceInstanceRelation.*).filter(detectPoint == DetectPoint.CLIENT).percent(status == true);
service_instance_relation_server_call_sla = from(ServiceInstanceRelation.*).filter(detectPoint == DetectPoint.SERVER).percent(status == true);
service_instance_relation_client_resp_time = from(ServiceInstanceRelation.latency).filter(detectPoint == DetectPoint.CLIENT).longAvg();
service_instance_relation_server_resp_time = from(ServiceInstanceRelation.latency).filter(detectPoint == DetectPoint.SERVER).longAvg();
service_instance_relation_client_percentile = from(ServiceInstanceRelation.latency).filter(detectPoint == DetectPoint.CLIENT).percentile(10); // Multiple values including p50, p75, p90, p95, p99
service_instance_relation_server_percentile = from(ServiceInstanceRelation.latency).filter(detectPoint == DetectPoint.SERVER).percentile(10); // Multiple values including p50, p75, p90, p95, p99

// Service Instance Scope metrics
service_instance_sla = from(ServiceInstance.*).percent(status == true);
service_instance_resp_time= from(ServiceInstance.latency).longAvg();
service_instance_cpm = from(ServiceInstance.*).cpm();

// Endpoint scope metrics
endpoint_cpm = from(Endpoint.*).cpm();
endpoint_avg = from(Endpoint.latency).longAvg();
endpoint_sla = from(Endpoint.*).percent(status == true);
endpoint_percentile = from(Endpoint.latency).percentile(10); // Multiple values including p50, p75, p90, p95, p99
endpoint_mq_consume_count = from(Endpoint.*).filter(type == RequestType.MQ).count();
endpoint_mq_consume_latency = from((str->long)Endpoint.tag["transmission.latency"]).filter(type == RequestType.MQ).filter(tag["transmission.latency"] != null).longAvg();

// Endpoint relation scope metrics
endpoint_relation_cpm = from(EndpointRelation.*).filter(detectPoint == DetectPoint.SERVER).cpm();
endpoint_relation_resp_time = from(EndpointRelation.rpcLatency).filter(detectPoint == DetectPoint.SERVER).longAvg();
endpoint_relation_sla = from(EndpointRelation.*).filter(detectPoint == DetectPoint.SERVER).percent(status == true);
endpoint_relation_percentile = from(EndpointRelation.rpcLatency).filter(detectPoint == DetectPoint.SERVER).percentile(10); // Multiple values including p50, p75, p90, p95, p99

database_access_resp_time = from(DatabaseAccess.latency).longAvg();
database_access_sla = from(DatabaseAccess.*).percent(status == true);
database_access_cpm = from(DatabaseAccess.*).cpm();
database_access_percentile = from(DatabaseAccess.latency).percentile(10);
如果想要调整默认的规则,比如监控返回的信息,监控的参数等等,只需要改动上述配置文件中的参数即可。
当然除了以上默认的几种规则,skywalking还适配了一些钩子(webhooks)。其实就是相当于一个回调,一旦触发了上述规则告警,skywalking则会调用配置的webhook,这样开发者就可以定制一些处理方法,比如发送邮件、微信、钉钉通知运维人员处理。
当然这个钩子也是有些规则的,如下:
- POST请求
- application/json 接收数据
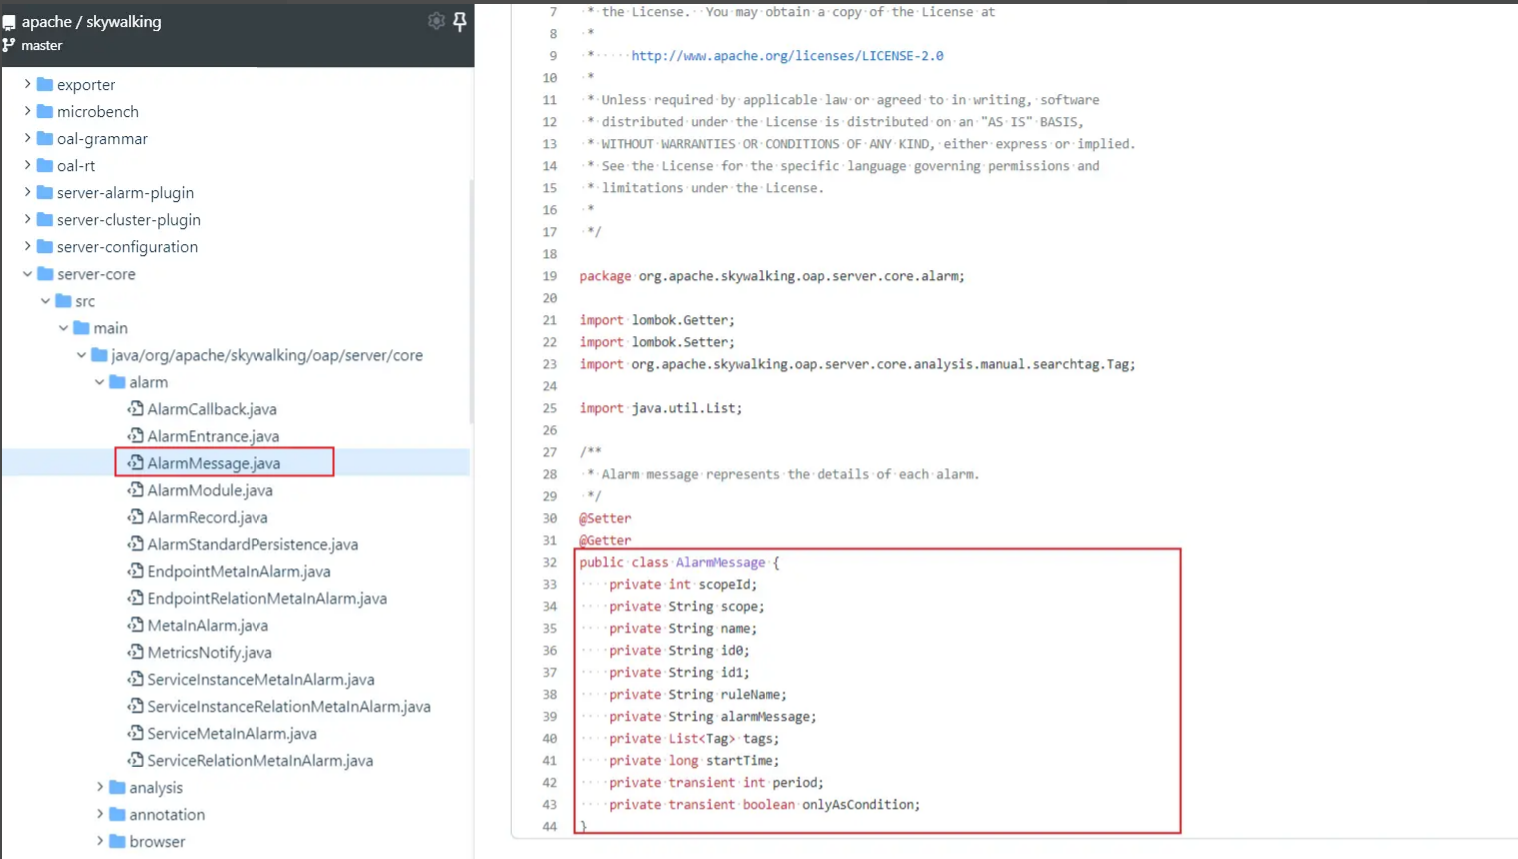
- 接收的参数必须是AlarmMessage中指定的参数。
注意:AlarmMessage这个类随着skywalking版本的迭代可能出现不同,一定要到对应版本源码中去找到这个类,拷贝其中的属性。这个类在源码的路径:
org.apache.skywalking.oap.server.core.alarm
,如下图:
事件
…
调试
…
日志对接
在skywalking的UI端有一个日志的模块,用于收集客户端的日志,默认是没有数据的,那么需要如何将日志数据传输到skywalking中呢?
日志框架的种类很多,比较出名的有log4j,logback,log4j2,以springboot默认的logback为例子介绍一下如何配置,官方文档如下:
- log4j:java-agent/application-toolkit-log4j-1.x/
- log4j2:java-agent/application-toolkit-log4j-2.x/
- logback:java-agent/application-toolkit-logback-1.x/
1、添加依赖
根据官方文档,需要先添加依赖,如下:
<dependency><groupId>org.apache.skywalking</groupId><artifactId>apm-toolkit-logback-1.x</artifactId><version>8.10.0</version></dependency>
2、添加配置文件
新建一个
logback-spring.xml
放在resource目录下,配置如下:
<?xml version="1.0" encoding="UTF-8"?><configurationscan="true"scanPeriod=" 5 seconds"><appendername="STDOUT"class="ch.qos.logback.core.ConsoleAppender"><encoderclass="ch.qos.logback.core.encoder.LayoutWrappingEncoder"><layoutclass="org.apache.skywalking.apm.toolkit.log.logback.v1.x.mdc.TraceIdMDCPatternLogbackLayout"><Pattern>%d{yyyy-MM-dd HH:mm:ss.SSS} [%X{tid}] [%thread] %-5level %logger{36} -%msg%n</Pattern></layout></encoder></appender><appendername="ASYNC"class="ch.qos.logback.classic.AsyncAppender"><discardingThreshold>0</discardingThreshold><queueSize>1024</queueSize><neverBlock>true</neverBlock><appender-refref="STDOUT"/></appender><appendername="grpc-log"class="org.apache.skywalking.apm.toolkit.log.logback.v1.x.log.GRPCLogClientAppender"><encoderclass="ch.qos.logback.core.encoder.LayoutWrappingEncoder"><layoutclass="org.apache.skywalking.apm.toolkit.log.logback.v1.x.mdc.TraceIdMDCPatternLogbackLayout"><Pattern>%d{yyyy-MM-dd HH:mm:ss.SSS} [%X{tid}] [%thread] %-5level %logger{36} -%msg%n</Pattern></layout></encoder></appender><rootlevel="INFO"><appender-refref="grpc-log"/><appender-refref="ASYNC"/></root></configuration>
3、接入探针agent
1)下载探针
https://archive.apache.org/dist/skywalking/java-agent/
根据Skywalking版本进行下载
2)idea使用探针
- 配置VM options
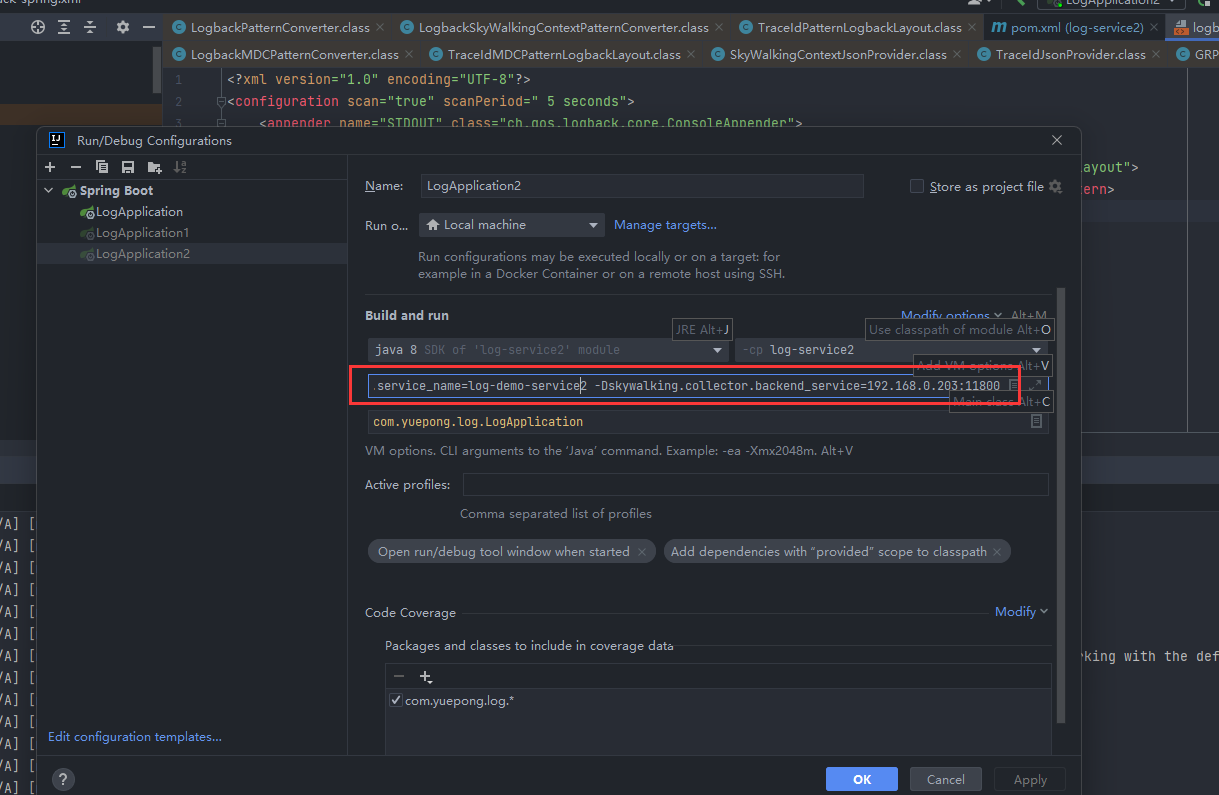
-javaagent:D:\Java\plugin\apache-skywalking-java-agent-8.9.0\skywalking-agent\skywalking-agent.jar -Dskywalking.agent.service_name=log-demo-service2 -Dskywalking.collector.backend_service=192.168.0.203:11800
参数说明-javaagent1)中下载的探针jar包位置-Dskywalking.agent.service_name在Skywalking中的服务名称,默认值为Your_ApplicationName-Dskywalking.collector.backend_serviceSkywalking地址,默认值为127.0.0.1:11800
如果在本地起的Skywalking,则没必要配置此参数
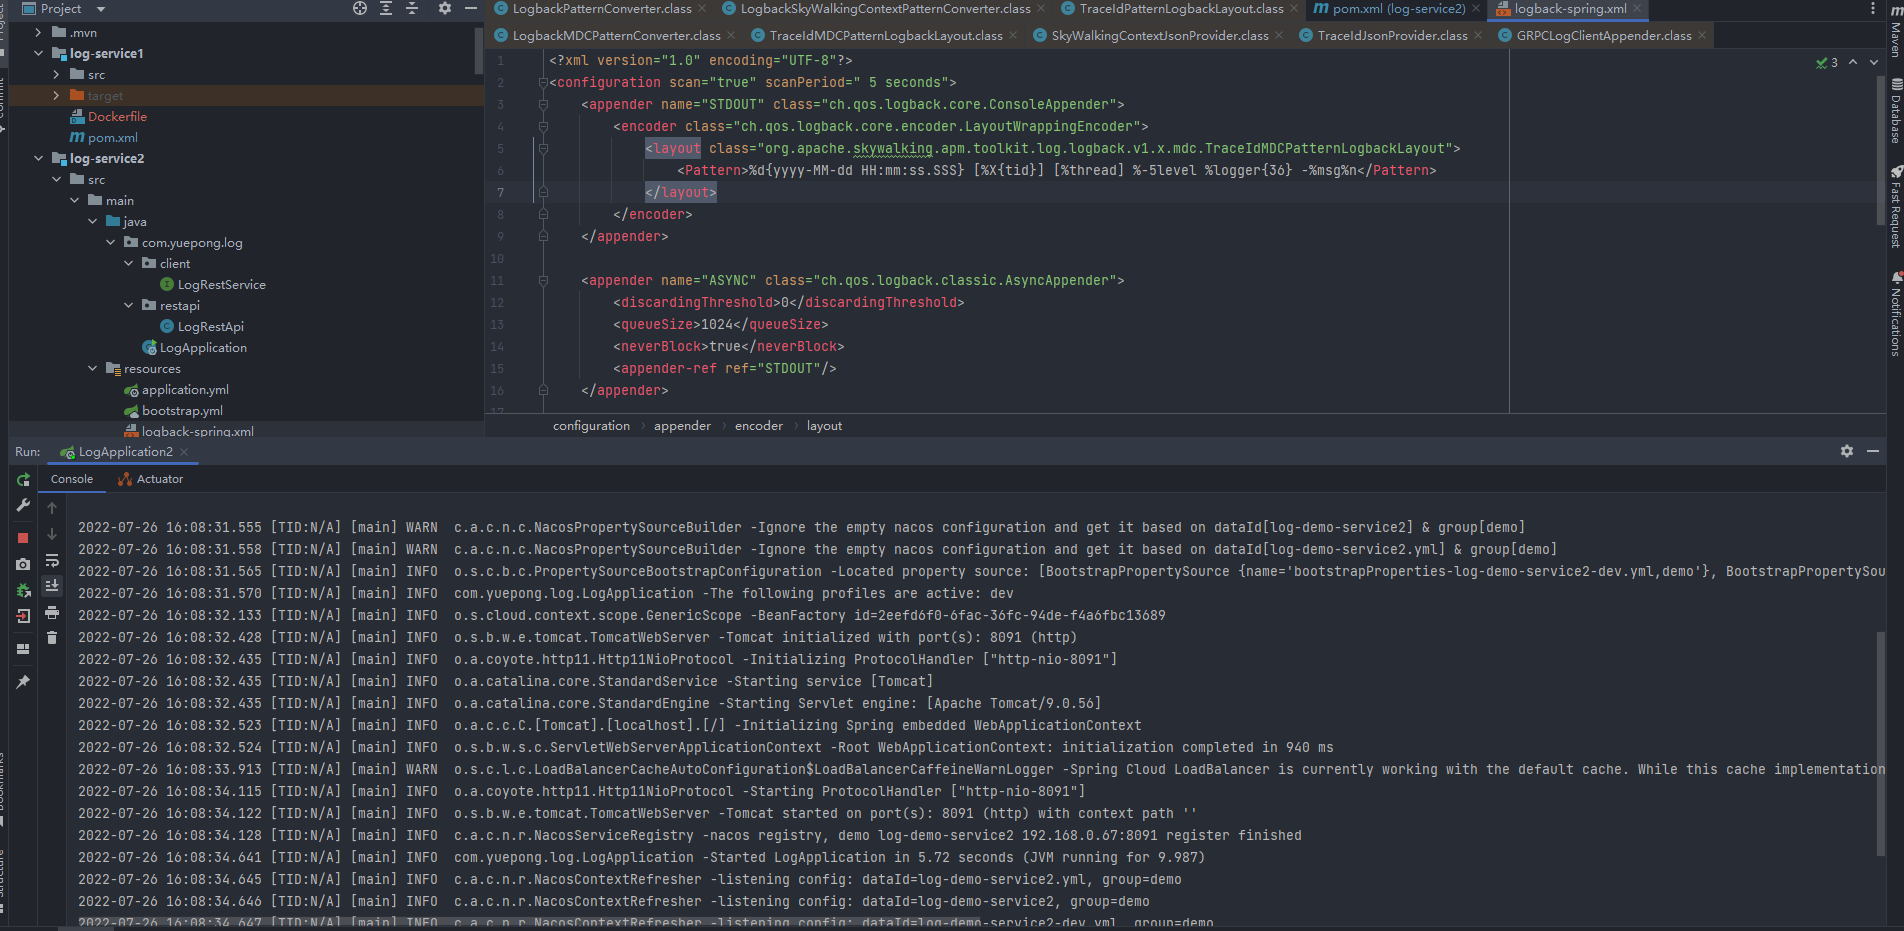
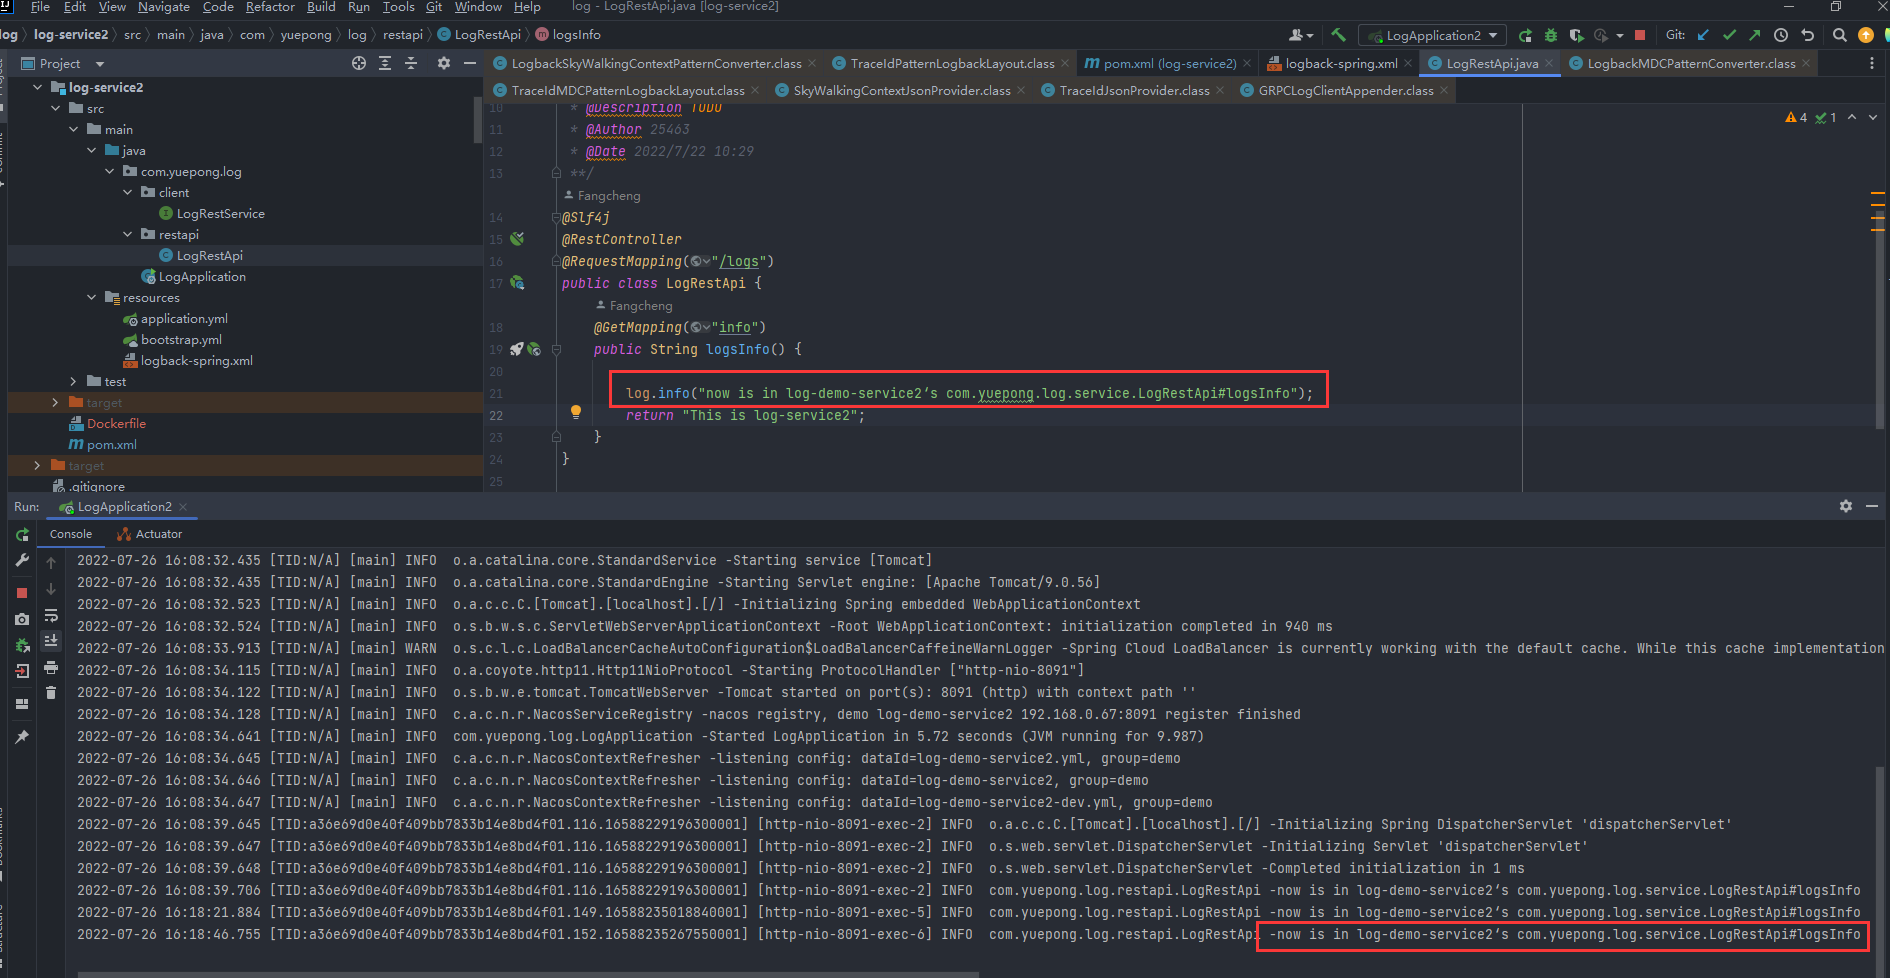
- 启动程序会发现Skywalking里已经有了日志,与idea控制台的日志一致。
- 调用接口
3)jar包使用探针
与idea一样,启动时配置VM options即可
java -javaagent:D:\Java\plugin\apache-skywalking-java-agent-8.9.0\skywalking-agent\skywalking-agent.jar -Dskywalking.agent.service_name=log-demo-service2 -Dskywalking.collector.backend_service=192.168.0.203:11800 -jar app.jar
4)docker使用探针
其实原理都一样,配置探针包的地址、配置skywalking服务端地址、配置服务名称。
有几种方式:
1、将外部的agent包,挂载到docker容器中,然后指定vm参数
2、构建docker时,把agent包打进docker镜像里,dockerfile修改enrtypoint,添加-javaagent参数
3、将agent包打到基础镜像里,dockerfile直接引用这个基础镜像
我采用第三种方式,而且这个基础镜像其实官方是有发布的,直接引用即可,但是只有几个版本,如果你的程序对jdk有要求,还是要采用其他方案,或者自己构建一个基础镜像。
在docker仓库里选择对应版本即可,镜像地址:https://hub.docker.com/r/apache/skywalking-java-agent,这个仓库是apache自己的,但是概述里有说明,这个不是ASF( Apache 软件基金会Apache Software Foundation)的官方版本
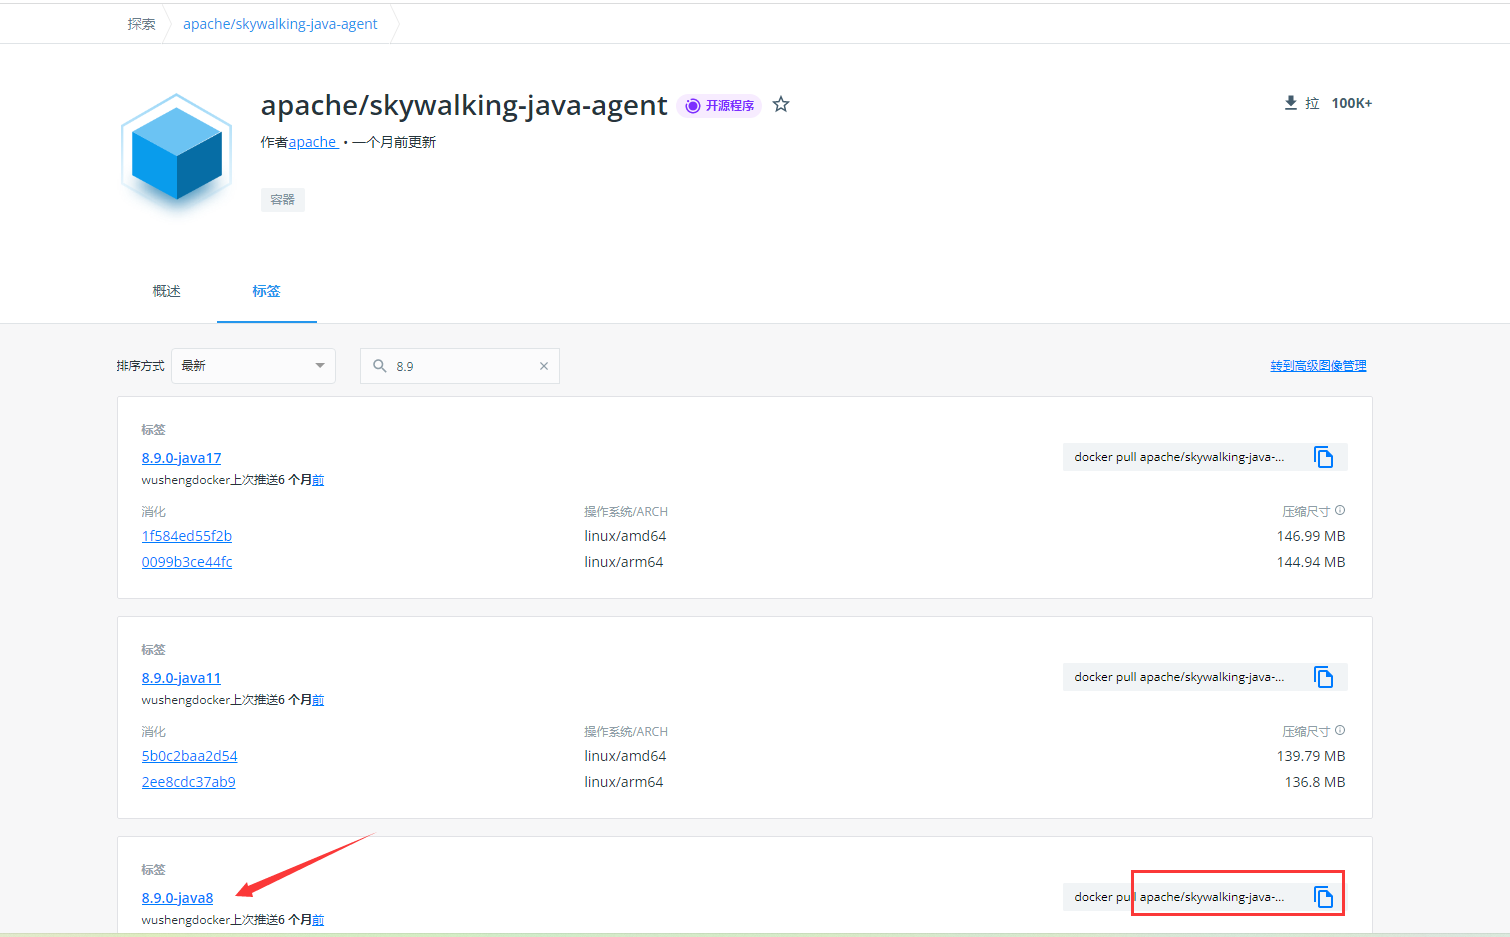
把这个替换到dockerfile中的FROM即可
FROM apache/skywalking-java-agent:8.9.0-java8
..
这个镜像自带探针包,无需指定探针包地址,那么其他两个参数怎么配置呢?
我是在docker-compose文件中配置了环境变量SW_AGENT_NAME与SW_AGENT_COLLECTOR_BACKEND_SERVICES
version:'2'services:log-demo-service1:image: log-service1:0.0.1-SKYWALKING
    container_name: log-demo-service-skywalking1
    restart: always
    ports:-"8090:8090"environment:TZ: Asia/Shanghai
      SW_AGENT_NAME: log-demo-service1
      SW_AGENT_COLLECTOR_BACKEND_SERVICES: 192.168.0.203:11800log-demo-service2:image: log-service2:0.0.1-SKYWALKING
    container_name: log-demo-service-skywalking2
    restart: always
    ports:-"8091:8091"environment:TZ: Asia/Shanghai
      SW_AGENT_NAME: log-demo-service2
      SW_AGENT_COLLECTOR_BACKEND_SERVICES: 192.168.0.203:11800
这两个变量是取自探针的配置文件/agent/config/agent.config
agent.service_name=${SW_AGENT_NAME:Your_ApplicationName}
collector.backend_service=${SW_AGENT_COLLECTOR_BACKEND_SERVICES:127.0.0.1:11800}
其实就对应着2)和3)中配置的VM options的-Dskywalking.agent.service_name和-Dskywalking.collector.backend_service,所以2)和3)中配置环境变量也是可以的。
启动docker-compose,会发现比idea中多了一行,就是这个基础镜像自带的配置,定义了一个JAVA_TOOL_OPTIONS,在这个变量里指定了agent包的位置。

参考:
SkyWalking UI指标使用说明(3)
SkyWalking之告警
SkyWalking解决分布式链路追踪,真香!
skywalking指南—agent日志采集和插件
版权归原作者 阿狸尬多 所有, 如有侵权,请联系我们删除。