
使用的框架: React
要使用的库: exceljs、handsontable
1. 概述
接到一个任务,是要前端实现文件预览效果,百度了一圈,发现也没有什么好的方法可以完美的将表格渲染出来。在前端中有
sheetjs
和
exceljs
可以对xlsx文件进行解析,本来一开始我用的是
sheetjs
,但是在样式获取上遇到了麻烦,所以我改用了
exceljs
,不过很难受,在样式获取时同样遇到了不小的麻烦,但是我懒得换回sheetjs了,那就直接使用
exceljs
吧。
要实现xlsx文件预览效果,我的想法是使用一个库对xlsx文件进行解析,然后使用另一个库对解析出来的数据在页面上进行绘制,综上,**我采用的方案是:
exceljs
handsontable
**
2. 实现步骤
2.1 安装库
使用命令:
npm i exceljs handsontable @handsontable/react
2.2 使用exceljs解析数据并使用handsontable进行渲染
直接贴代码了:
import Excel from'exceljs'import{ useState }from'react';import{ HotTable }from'@handsontable/react';import{ registerAllModules }from'handsontable/registry';import'handsontable/dist/handsontable.full.min.css';import{ textRenderer, registerRenderer }from'handsontable/renderers';// 注册模块registerAllModules();exportdefaultfunctionXLSXPreView(){const[data, setData]=useState([]);consthandleFile=async(e)=>{const file = e.target.files[0];const workbook =newExcel.Workbook();await workbook.xlsx.load(file)// 第一个工作表const worksheet = workbook.getWorksheet(1);// 遍历工作表中的所有行(包括空行)const sheetData =[];
        worksheet.eachRow({includeEmpty:true},function(row, rowNumber){// console.log('Row ' + rowNumber + ' = ' + JSON.stringify(row.values));// 使用row.values获取每一行的值时总会多出一条空数据(第一条),这里我把它删除const row_values = row.values.slice(1);
            sheetData.push(row_values)});setData(sheetData);}return(<><input type="file" onChange={handleFile}/><div id='table_view'><HotTable
                    data={data}
                    readOnly={true}
                    rowHeaders={true}
                    colHeaders={true}
                    width="100vw"
                    height="auto"
                    licenseKey='non-commercial-and-evaluation'// 一定得加这个,handsontable是收费的,加了这个才能免费用/></div></>)}
到这里,已经实现了从xlsx文件中获取数据,并使用handsontable将表格中的数据渲染出来,示例结果如下,如果只需要将数据显示出来,并不需要将样式什么的一起复现了,那到这里就已经结束了!
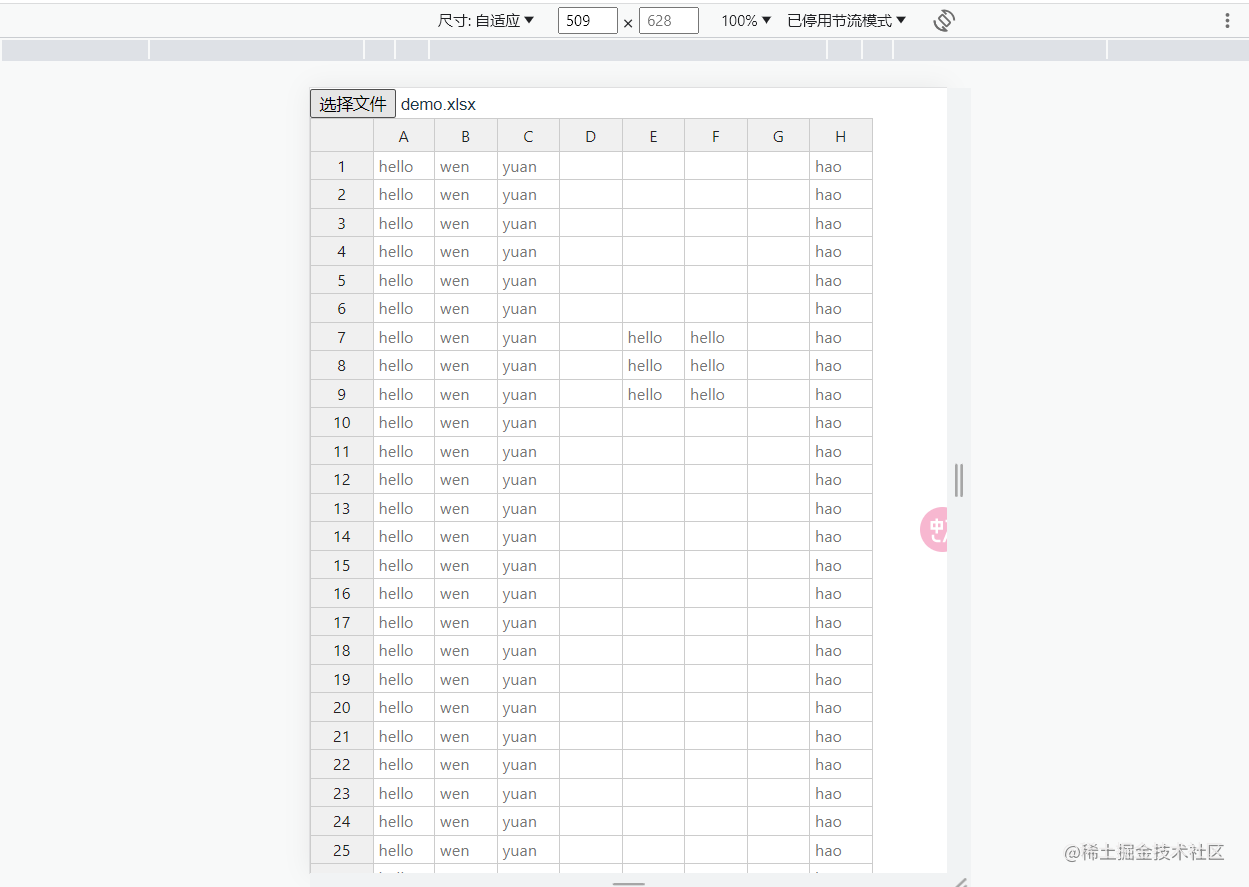
但事实上,这并不是我要做到效果,我的xlsx里面还有样式什么的,也需要复现,头疼😔
3. 其它的杂七杂八
3.1 单元格样式
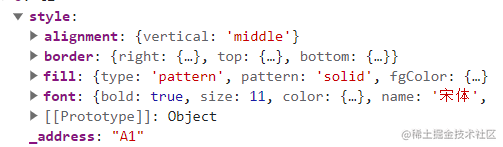
事实上,在exceljs解析xlsx文件时,它顺带一起把样式获取到了,通过
worksheet.getCell(1, 1).style
可以获取对应单元格的样式,如下,背景色存放在
fill.fgColor
中,字体颜色存放在
font.color
中,这样的话只需要将这些样式一一赋值给handsontable组件再添加样式就好了。
但是实际操作的时候却遇到了问题,先说excel中的颜色,在选择颜色时,应该都会打开下面这个选项框吧,如果你选择的是标准色,它获取到的颜色就是十六进制,但是如果你选择主题中的颜色,那就是另一种结果了,并且还会有不同的深暗程度tint,这就很难受了!
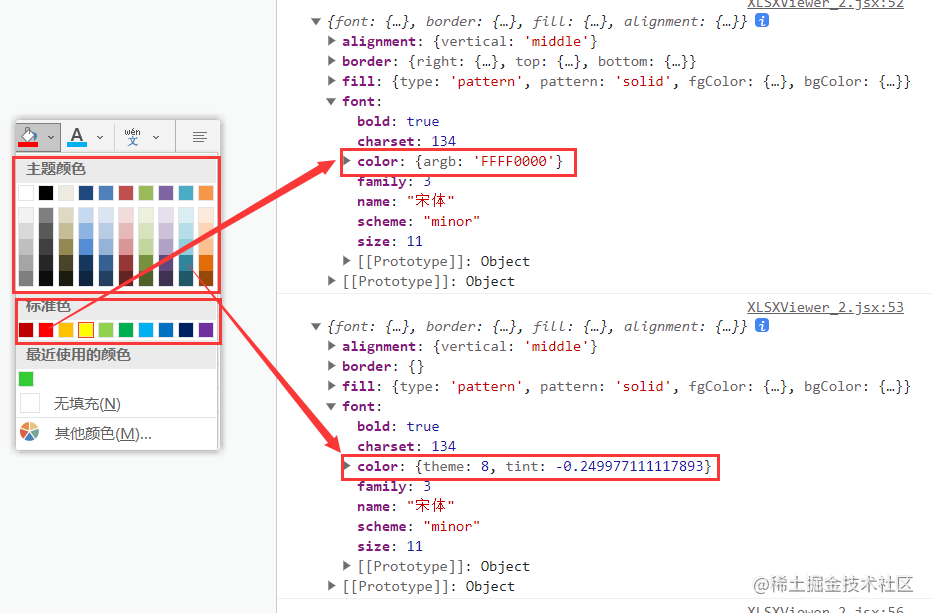
随后在控制台中打印了
workbook
,发现它把主题返回了,可以通过
work._themes.theme1
获取,不过获取到的是xml格式的字符串,由于xml我没学,我不会,所以我就把它转换成json来进行处理了。
第一步
安装xml转json的库:
npm i fast-xml-parser
import{XMLParser}from'fast-xml-parser'// 将主题xml转换成jsonconst themeXml = workbook._themes.theme1;const options ={ignoreAttributes:false,attributeNamePrefix:'_'}const parser =newXMLParser(options);const json = parser.parse(themeXml)setThemeJson(json);
其实它的theme好像是固定的,也可以在一些格式转换的网站中直接转换成json然后放到一个json文件中,读取就行,我这里就直接放到一个state中了!
第二步
接下来就是重头戏了!设置单元格样式…
首先安装一个处理颜色的库color,用来根据tint获得不同明暗程度的颜色:
npm i color
下面是获取颜色的函数:
// 根据主题和明暗度获取颜色constgetThemeColor=(themeJson, themeId, tint)=>{let color ='';const themeColorScheme = themeJson['a:theme']['a:themeElements']['a:clrScheme'];switch(themeId){case0:
            color = themeColorScheme['a:lt1']['a:sysClr']['_lastClr'];break;case1:
            color = themeColorScheme['a:dk1']['a:sysClr']['_lastClr'];break;case2:
            color = themeColorScheme['a:lt2']['a:srgbClr']['_val'];break;case3:
            color = themeColorScheme['a:dk2']['a:srgbClr']['_val'];break;default:
            color = themeColorScheme[`a:accent${themeId-3}`]['a:srgbClr']['_val'];break;}// 根据tint修改颜色深浅
    color ='#'+ color;const colorObj =Color(color);if(tint){if(tint>0){// 淡色
            color = colorObj.lighten(tint).hex();}else{// 深色
            color = colorObj.darken(Math.abs(tint)).hex();}}return color;}// 获取颜色constgetColor=(obj, themeJson)=>{if('argb'in obj){// 标准色 // rgba格式去掉前两位: FFFF0000 -> FF0000return'#'+ obj.argb.substring(2);}elseif('theme'in obj){// 主题颜色if('tint'in obj){returngetThemeColor(themeJson, obj.theme, obj.tint);}else{returngetThemeColor(themeJson, obj.theme,null);}}}
然后设置handonsontable的单元格的一些样式:颜色、加粗、下划线、边框balabala…的
顺带把行高和列宽一起设置了,这个还比较简单,就一笔带过了…
3.2 合并单元格
从获取到的sheet中有一个
_meages
属性,该属性中存放了表格中所有的合并单元格区域,所以只需要将它们重新渲染在handsontable中就好。
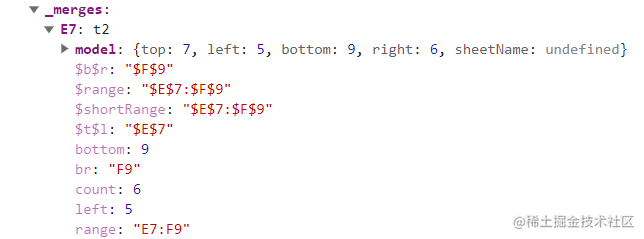
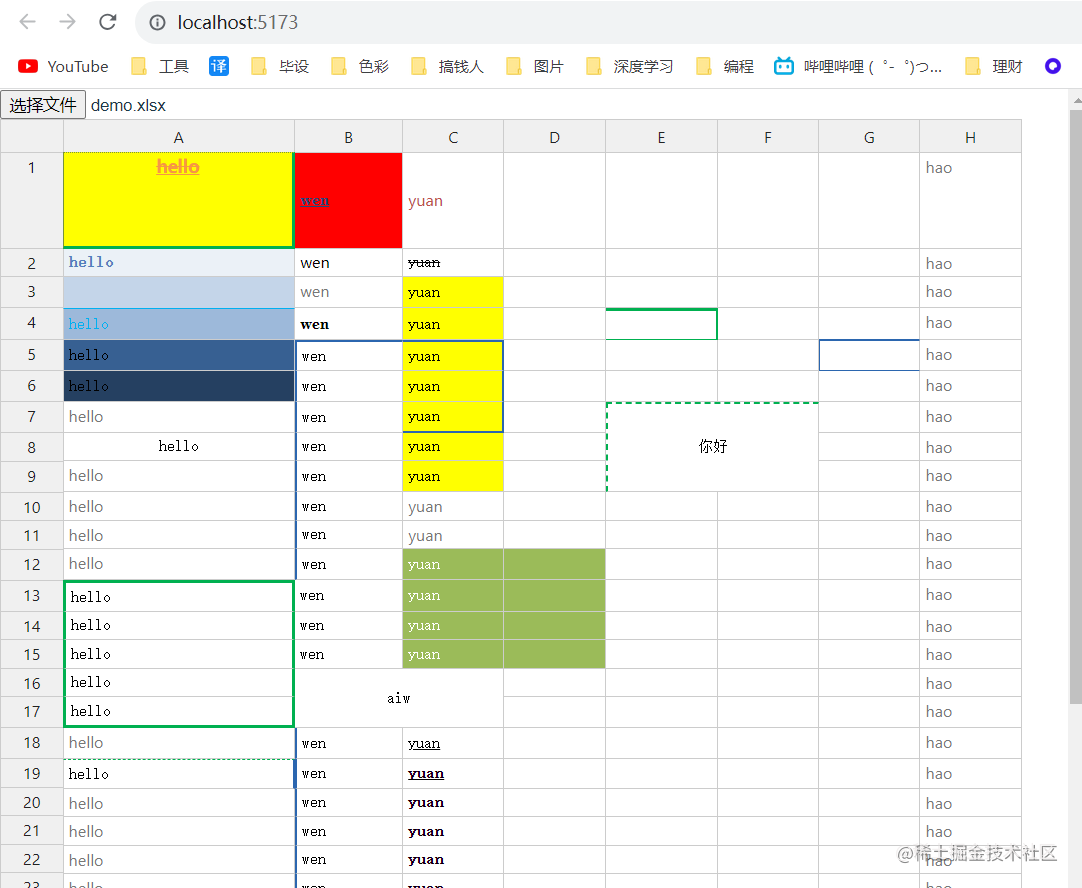
然后就实现了表格的一些基本功能的预览,结果如下图:
3. 总结(附全代码)
其实这个的本质主要就是通过ecxeljs解析表格文件的数据,然后通过handsontable将它们重新绘制在页面上,个人觉得这种方法并不好,因为表格里的操作太多了要把它们一一绘制工作量实在是太大了,而且很麻烦,我这里把表格的一些常用到的功能实现了预览,还有想表格里放图片什么的都没有实现,如果有需要,可以根据需求再进行进行写。
我写的其实还有一点bug,单元格的边框样式我只设置了solid和dashed,但事实上excel中单元格的边框有12种样式,而且还有对角线边框,设置起来好麻烦,我就不弄了,大家用的时候注意一下哈,有需要的话可以自己修改一下!
附上全部代码:
/**
 *  exceljs + handsontable
 */import Excel from'exceljs'import{ useState }from'react';import{ HotTable }from'@handsontable/react';import{ registerAllModules }from'handsontable/registry';import'handsontable/dist/handsontable.full.min.css';import{ textRenderer, registerRenderer }from'handsontable/renderers';import{XMLParser}from'fast-xml-parser'import Color from'color';// 注册模块registerAllModules();// 根据主题和明暗度获取颜色constgetThemeColor=(themeJson, themeId, tint)=>{let color ='';const themeColorScheme = themeJson['a:theme']['a:themeElements']['a:clrScheme'];switch(themeId){case0:
            color = themeColorScheme['a:lt1']['a:sysClr']['_lastClr'];break;case1:
            color = themeColorScheme['a:dk1']['a:sysClr']['_lastClr'];break;case2:
            color = themeColorScheme['a:lt2']['a:srgbClr']['_val'];break;case3:
            color = themeColorScheme['a:dk2']['a:srgbClr']['_val'];break;default:
            color = themeColorScheme[`a:accent${themeId-3}`]['a:srgbClr']['_val'];break;}// 根据tint修改颜色深浅
    color ='#'+ color;const colorObj =Color(color);if(tint){if(tint>0){// 淡色
            color = colorObj.lighten(tint).hex();}else{// 深色
            color = colorObj.darken(Math.abs(tint)).hex();}}return color;}// 获取颜色constgetColor=(obj, themeJson)=>{if('argb'in obj){// 标准色 // rgba格式去掉前两位: FFFF0000 -> FF0000return'#'+ obj.argb.substring(2);}elseif('theme'in obj){// 主题颜色if('tint'in obj){returngetThemeColor(themeJson, obj.theme, obj.tint);}else{returngetThemeColor(themeJson, obj.theme,null);}}}// 设置边框constsetBorder=(style)=>{let borderStyle ='solid';let borderWidth ='1px';switch(style){case'thin':
            borderWidth ='thin';break;case'dotted':
            borderStyle ='dotted';break;case'dashDot':
            borderStyle ='dashed';break;case'hair':
            borderStyle ='solid';break;case'dashDotDot':
            borderStyle ='dashed';break;case'slantDashDot':
            borderStyle ='dashed';break;case'medium':
            borderWidth ='2px';break;case'mediumDashed':
            borderStyle ='dashed';
            borderWidth ='2px';break;case'mediumDashDotDot':
            borderStyle ='dashed';
            borderWidth ='2px';break;case'mdeiumDashDot':
            borderStyle ='dashed';
            borderWidth ='2px';break;case'double':
            borderStyle ='double';break;case'thick':
            borderWidth ='3px';break;default:break;}// console.log(borderStyle, borderWidth);return[borderStyle, borderWidth];}exportdefaultfunctionXLSXPreView(){// 表格数据const[data, setData]=useState([]);// 表格const[sheet, setSheet]=useState([]);// 主题const[themeJson, setThemeJson]=useState([]);// 合并的单元格const[mergeRanges, setMergeRanges]=useState([]);registerRenderer('customStylesRenderer',(hotInstance, td, row, column, prop, value, cellProperties)=>{textRenderer(hotInstance, td, row, column, prop, value, cellProperties);// console.log(cellProperties);// 填充样式if('fill'in cellProperties){// 背景颜色if('fgColor'in cellProperties.fill && cellProperties.fill.fgColor){
                td.style.background =getColor(cellProperties.fill.fgColor, themeJson);}}// 字体样式if('font'in cellProperties){// 加粗if('bold'in cellProperties.font && cellProperties.font.bold){
                td.style.fontWeight ='700';}// 字体颜色if('color'in cellProperties.font && cellProperties.font.color){
                td.style.color =getColor(cellProperties.font.color, themeJson);}// 字体大小if('size'in cellProperties.font && cellProperties.font.size){
                td.style.fontSize = cellProperties.font.size +'px';}// 字体类型if('name'in cellProperties.font && cellProperties.font.name){
                td.style.fontFamily = cellProperties.font.name;}// 字体倾斜if('italic'in cellProperties.font && cellProperties.font.italic){
                td.style.fontStyle ='italic';}// 下划线if('underline'in cellProperties.font && cellProperties.font.underline){// 其实还有双下划线,但是双下划綫css中没有提供直接的设置方式,需要使用额外的css设置,所以我也就先懒得弄了
                td.style.textDecoration ='underline';// 删除线if('strike'in cellProperties.font && cellProperties.font.strike){
                    td.style.textDecoration ='underline line-through';}}else{// 删除线if('strike'in cellProperties.font && cellProperties.font.strike){
                    td.style.textDecoration ='line-through';}}}// 对齐if('alignment'in cellProperties){if('horizontal'in cellProperties.alignment){// 水平// 这里我直接用handsontable内置类做了,设置成类似htLeft的样子。//(handsontable)其实至支持htLeft, htCenter, htRight, htJustify四种,但是其是它还有centerContinuous、distributed、fill,遇到这几种就会没有效果,也可以自己设置,但是我还是懒的弄了,用到的时候再说吧const name =  cellProperties.alignment.horizontal.charAt(0).toUpperCase()+ cellProperties.alignment.horizontal.slice(1);
                td.classList.add(`ht${name}`);}if('vertical'in cellProperties.alignment){// 垂直// 这里我直接用handsontable内置类做了,设置成类似htTop的样子。const name =  cellProperties.alignment.vertical.charAt(0).toUpperCase()+ cellProperties.alignment.vertical.slice(1);
                td.classList.add(`ht${name}`);}}// 边框if('border'in cellProperties){if('left'in cellProperties.border &&  cellProperties.border.left){// 左边框const[borderWidth, borderStyle]=setBorder(cellProperties.border.left.style);let color ='';// console.log(row, column, borderWidth, borderStyle);if(cellProperties.border.left.color){
                    color =getColor(cellProperties.border.left.color, themeJson);}
                td.style.borderLeft =`${borderStyle}${borderWidth}${color}`;}if('right'in cellProperties.border &&  cellProperties.border.right){// 左边框const[borderWidth, borderStyle]=setBorder(cellProperties.border.right.style);// console.log(row, column, borderWidth, borderStyle);let color ='';if(cellProperties.border.right.color){
                    color =getColor(cellProperties.border.right.color, themeJson);}
                td.style.borderRight =`${borderStyle}${borderWidth}${color}`;}if('top'in cellProperties.border &&  cellProperties.border.top){// 左边框const[borderWidth, borderStyle]=setBorder(cellProperties.border.top.style);let color ='';// console.log(row, column, borderWidth, borderStyle);if(cellProperties.border.top.color){
                    color =getColor(cellProperties.border.top.color, themeJson);}
                td.style.borderTop =`${borderStyle}${borderWidth}${color}`;}if('bottom'in cellProperties.border &&  cellProperties.border.bottom){// 左边框const[borderWidth, borderStyle]=setBorder(cellProperties.border.bottom.style);let color ='';// console.log(row, column, borderWidth, borderStyle);if(cellProperties.border.bottom.color){
                    color =getColor(cellProperties.border.bottom.color, themeJson);}
                td.style.borderBottom =`${borderStyle}${borderWidth}${color}`;}}});consthandleFile=async(e)=>{const file = e.target.files[0];const workbook =newExcel.Workbook();await workbook.xlsx.load(file)const worksheet = workbook.getWorksheet(1);// const sheetRows = worksheet.getRows(1, worksheet.rowCount);setSheet(worksheet)// console.log(worksheet.getCell(1, 1).style);// 遍历工作表中的所有行(包括空行)const sheetData =[];
        worksheet.eachRow({includeEmpty:true},function(row, rowNumber){// console.log('Row ' + rowNumber + ' = ' + JSON.stringify(row.values));// 使用row.values获取每一行的值时总会多出一条空数据(第一条),这里我把它删除const row_values = row.values.slice(1);
            sheetData.push(row_values)});setData(sheetData);// 将主题xml转换成jsonconst themeXml = workbook._themes.theme1;const options ={ignoreAttributes:false,attributeNamePrefix:'_'}const parser =newXMLParser(options);const json = parser.parse(themeXml)setThemeJson(json);// 获取合并的单元格const mergeCells =[];for(let i in worksheet._merges){const{top, left, bottom, right}= worksheet._merges[i].model;
            mergeCells.push({row: top-1,col: left-1,rowspan: bottom-top+1,colspan: right-left+1})}setMergeRanges(mergeCells)
        console.log(worksheet);}return(<><input type="file" onChange={handleFile}/><div id='table_view'><HotTable
                    data={data}
                    readOnly={true}
                    rowHeaders={true}
                    colHeaders={true}
                    width="100vw"
                    height="auto"
                    licenseKey='non-commercial-and-evaluation'
                    rowHeights={function(index){if(sheet.getRow(index+1).height){// exceljs获取的行高不是像素值,事实上,它是23px - 13.8 的一个映射。所以需要将它转化为像素值return sheet.getRow(index+1).height *(23/13.8);}return23;// 默认}}
                    colWidths={function(index){if(sheet.getColumn(index+1).width){// exceljs获取的列宽不是像素值,事实上,它是81px - 8.22 的一个映射。所以需要将它转化为像素值return sheet.getColumn(index+1).width *(81/8.22);}return81;// 默认}}
                    cells={(row, col, prop)=>{const cellProperties  ={};const cellStyle = sheet.getCell(row+1, col+1).style

                        if(JSON.stringify(cellStyle)!=='{}'){// console.log(row+1, col+1, cellStyle);for(let key in cellStyle){
                                cellProperties[key]= cellStyle[key];}}return{...cellProperties,renderer:'customStylesRenderer'};}}
                    mergeCells={mergeRanges}/></div></>)}
版权归原作者 我不是idol 所有, 如有侵权,请联系我们删除。