
文章目录
一、各部分介绍
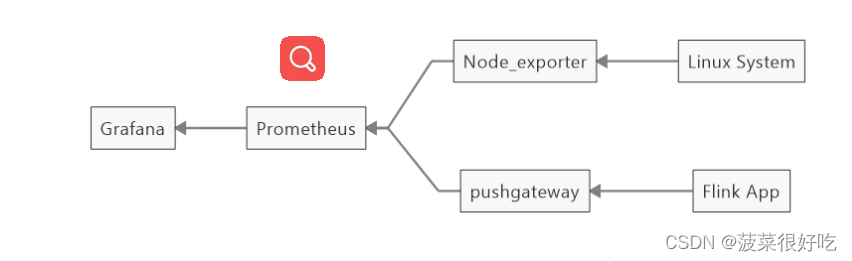
- 采集层 flink APP和linux system两部分,是我们要收集指标数据的组件
- 传输层 Pushgateway:是一个推送收集和推送数据的组件 Node_exporter:数据导出组件
- 存储计算层 Prometheus:系统监控和预警框架
- 应用层 Grafana:可视化展示平台
二、安装配置
1、安装pushgateway
#在线下载#离线下载直接访问地址wgetwget https://github.com/prometheus/pushgateway/releases/download/v1.4.3/pushgateway-1.4.3.linux-amd64.tar.gz
tar -zxvf pushgateway-1.4.3.linux-amd64.tar.gz -C /usr/local/
cd /usr/local/pushgateway-1.4.3.linux-amd64/
#后台启动nohup ./pushgateway > run.log 2>&1&#查看端口验证netstat -tlanp |grep9090#cmd验证是否联通
telnet 39.105.12.10 9090#停止 找到9090的进程杀掉即可kill -9 进程号
浏览器打开: http://ip服务器:9090
2、安装Prometheus
#官网下载地址https://prometheus.io/download/tar -zxvf prometheus-2.45.0.linux-amd64.tar.gz
vim prometheus.yml #修改配置文件#启动nohup ./prometheus  --config.file=prometheus.yml > ./prometheus.log 2>&1&#停止kill -9 进程号
修改配置文件 prometheus.yml
添加如下内容:
在 scrape_configs 配置项下添加配置:
scrape_configs:
- job_name: 'prometheus'
static_configs:
- targets: ['xx.xx.xx.xx:9090']
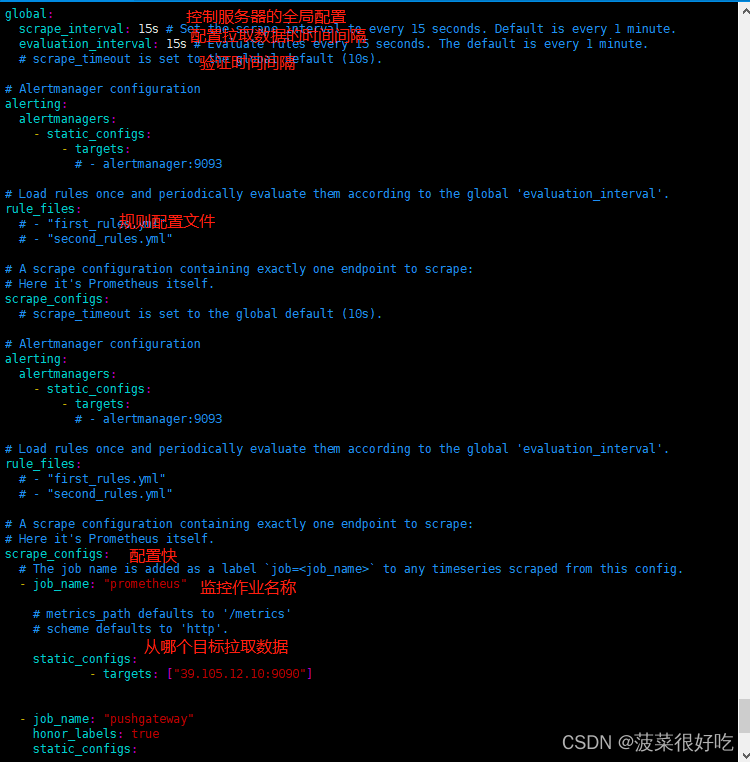
配置说明:
1 、 global 配置块: 控制 Prometheus 服务器的全局配置
➢ scrape_interval :配置拉取数据的时间间隔,默认为 1 分钟。
➢ evaluation_interval :规则验证(生成 alert )的时间间隔,默认为 1 分钟。
2 、 rule_files 配置块: 规则配置文件
3 、 scrape_configs 配置块: 配置采集目标相关, prometheus 监视的目标。 Prometheus 自身
的运行信息可以通过 HTTP 访问,所以 Prometheus 可以监控自己的运行数据。
➢ job_name :监控作业的名称
➢ static_configs :表示静态目标配置,就是固定从某个 target 拉取数据
➢ targets : 指 定 监 控 的 目 标 , 其 实 就 是 从 哪 儿 拉 取 数 据 。 Prometheus 会 从
http://hadoop1:9090/metrics 上拉取数据。
注意:Prometheus 是可以在运行时自动加载配置的。启动时需要添加: --web.enable-lifecycle
浏览器打开: http://ip服务器:9090
3、Grafana 安装
#yum在线安装
yum install grafana
# 下载安装,离线下载直接请求urlwget https://dl.grafana.com/enterprise/release/grafana-enterprise_10.0.1_amd64.deb
#在线安装启动service grafana-server start
service grafana-server status
netstat -tlanp |grep3000#离线安装启动
./bin/grafana-server
浏览器打开: http://ip服务器:3000
默认用户名密码:admin/admin
三、测试使用
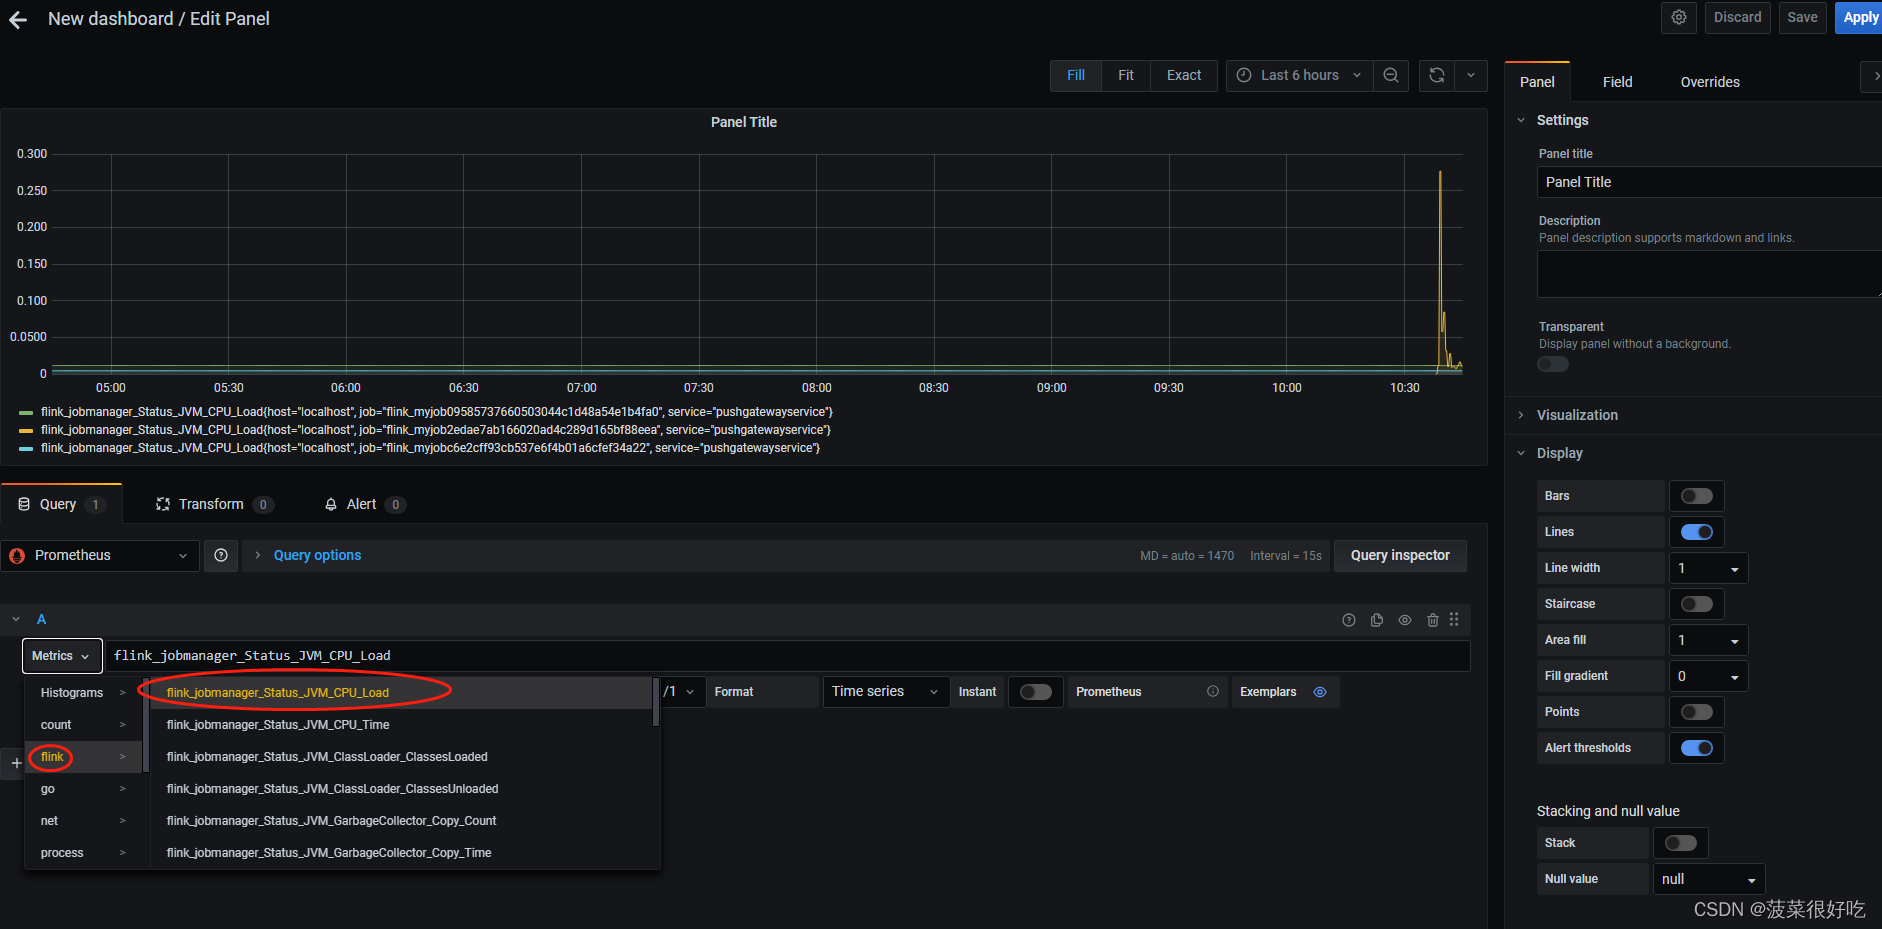
第一步:prometheus配置grafana
第二步:prometheus测试配置pushgateway,编辑脚本,定时执行测试
vim pushgateway.sh #编写pushgateway脚本采集数据#!/bin/bashinstance_name=`hostname -f |cut -d'.' -f1`#截取主机名if[$instance_name=="localhost"];thenecho"Must FQDN hostname"#要求主机名不能是localhost,不要主机名区别不了exit1filabel="count_netstat_wait_connections"#定义一个keycount_netstat_wait_connections=`netstat -an|grep -i wait|wc -l`#定义values#推送数据给pushgatewayecho"$label$count_netstat_wait_connections"|curl --data-binary @- http://192.168.118.133:9091/metrics/job/${instance_name}
#解析curl --data-binary是将http post 请求中的二进制数据发送给http服务服务器,这里的http服务器指的就是pushgateway服务器;
 指定pushgateway的ip地址和端口号,后面${instance_name}是指定job的名称,这里以主机名命名。
crontab -e
* * * * * bash /opt/pushgateway.sh
# 依次按 :wq 进行保存  即时生效
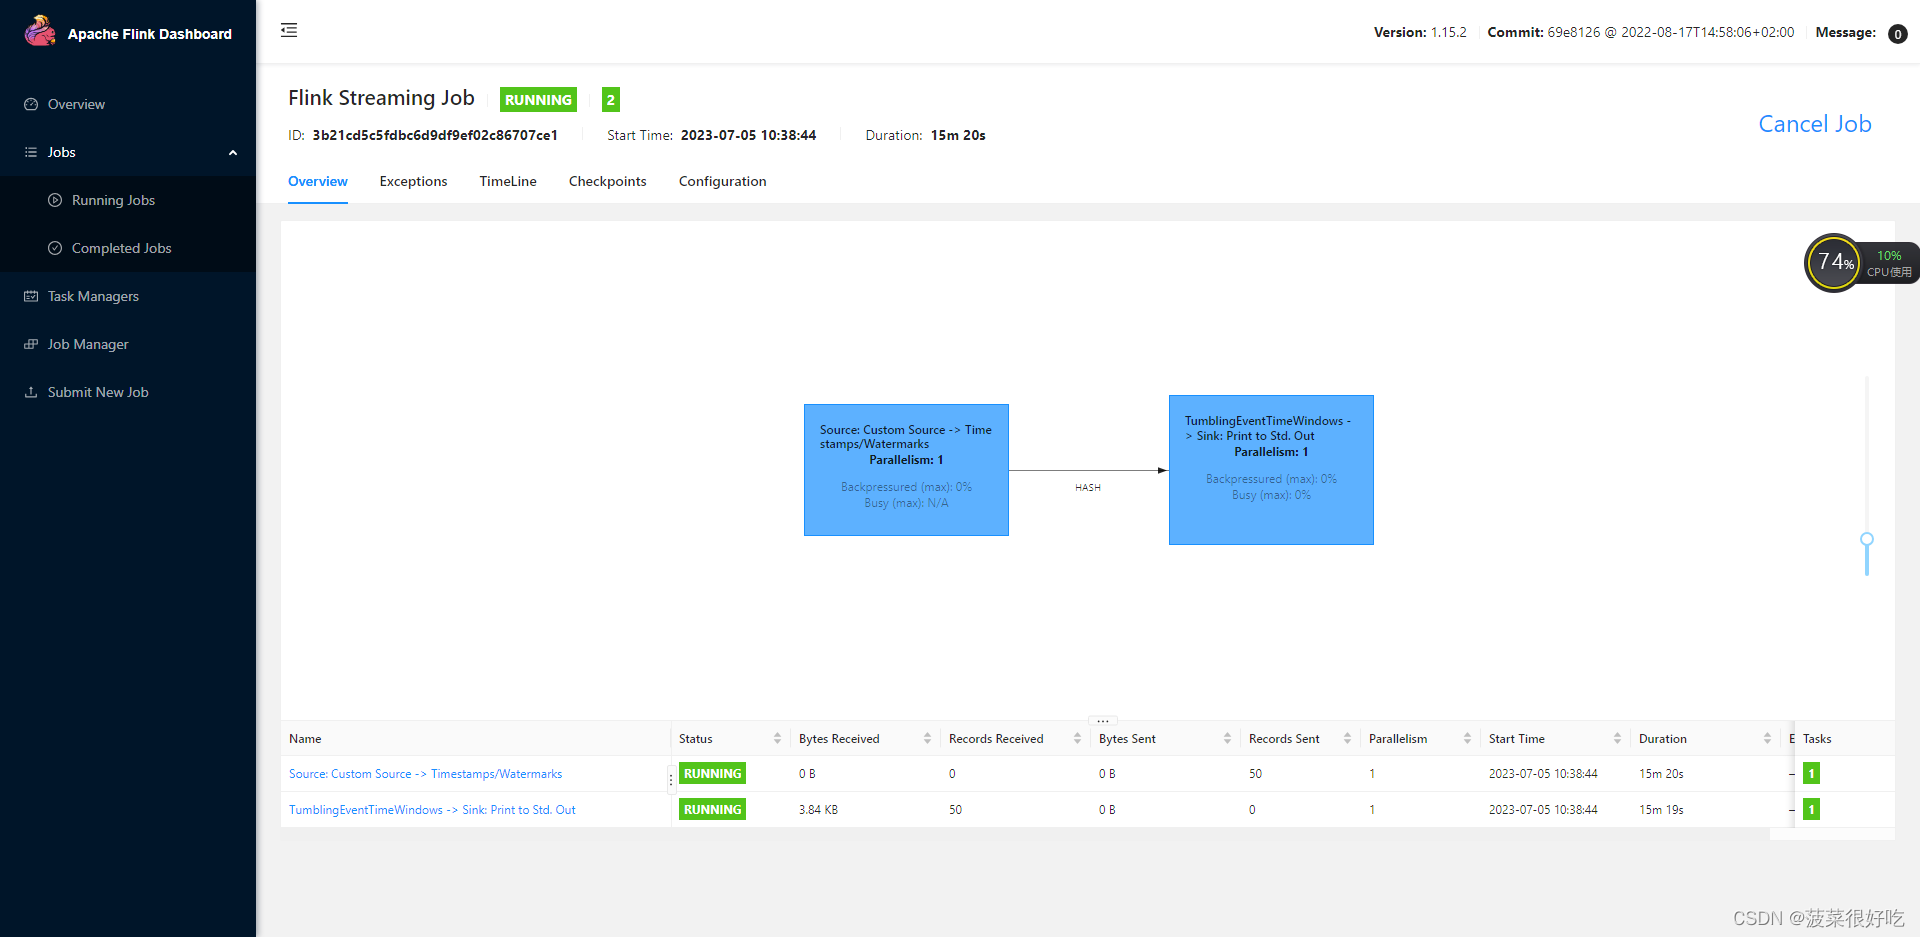
第三步:prometheus关联flink,flink-conf.yaml里添加配置
##### 与 Prometheus 集成配置 #####
metrics.reporter.promgateway.class:
org.apache.flink.metrics.prometheus.PrometheusPushGatewayReporter
# PushGateway 的主机名与端口号
metrics.reporter.promgateway.host: localhost
metrics.reporter.promgateway.port: 9091
# Flink metric 在前端展示的标签(前缀)与随机后缀
metrics.reporter.promgateway.jobName: myJob
metrics.reporter.promgateway.randomJobNameSuffix: true
metrics.reporter.promgateway.deleteOnShutdown: false
metrics.reporter.promgateway.interval: 30 SECONDS
第四步:flink安装目录里plugins下拷贝flink-metrics-prometheus-1.15.2.jar到lib
cp plugins/metrics-prometheus/flink-metrics-prometheus-1.15.2.jar ../../lib/
版权归原作者 菠菜很好吃 所有, 如有侵权,请联系我们删除。