
- 首先,在项目中安装 D3.js 和 Vue 3.0:
npm install d3@^7.0.0
npm install vue@^3.0.0
- Vue组件中引入 D3.js
import * as d3 from 'd3';
- 在 Vue 组件中定义一个 data 对象,用于存储拓扑结构的节点和边:
data() {
  return {
    nodes: [
      {id: 1, name: 'Node 1'},
      {id: 2, name: 'Node 2'},
      {id: 3, name: 'Node 3'}
    ],
    links: [
      {source: 1, target: 2},
      {source: 1, target: 3}
    ]
  }
}
- 在 Vue 组件的 mounted 生命周期中使用 D3.js 绘制拓扑结构:
mounted() {
  const svg = d3.select('#topology');
  const width = svg.attr('width');
  const height = svg.attr('height');

  const simulation = d3.forceSimulation(this.nodes)
    .force('link', d3.forceLink(this.links).id(d => d.id))
    .force('charge', d3.forceManyBody())
    .force('center', d3.forceCenter(width / 2, height / 2));

  const link = svg.selectAll('line')
    .data(this.links)
    .enter()
    .append('line')
    .attr('stroke', '#ccc')
    .attr('stroke-width', 1);

  const node = svg.selectAll('circle')
    .data(this.nodes)
    .enter()
    .append('circle')
    .attr('r', 10)
    .attr('fill', 'blue')
    .call(d3.drag()
      .on('start', dragstarted)
      .on('drag', dragged)
      .on('end', dragended));

  node.append('title')
    .text(d => d.name);

  simulation.on('tick', () => {
    link
      .attr('x1', d => d.source.x)
      .attr('y1', d => d.source.y)
      .attr('x2', d => d.target.x)
      .attr('y2', d => d.target.y);

    node
      .attr('cx', d => d.x)
      .attr('cy', d => d.y);
  });

  function dragstarted(event, d) {
    if (!event.active) simulation.alphaTarget(0.3).restart();
    d.fx = d.x;
    d.fy = d.y;
  }

  function dragged(event, d) {
    d.fx = event.x;
    d.fy = event.y;
  }

  function dragended(event, d) {
    if (!event.active) simulation.alphaTarget(0);
    d.fx = null;
    d.fy = null;
  }
}
- 在 Vue 组件的 template 中添加一个 SVG 元素用于显示拓扑结构:
<template>
  <div>
    <svg id="topology" width="600" height="400"></svg>
  </div>
</template>
完整代码实现
<template>
<div>
<svg id="topology" width="600" height="400"></svg>
</div>
</template>
<script>
import * as d3 from 'd3';
export default {
name: "topology",
data() {
return {
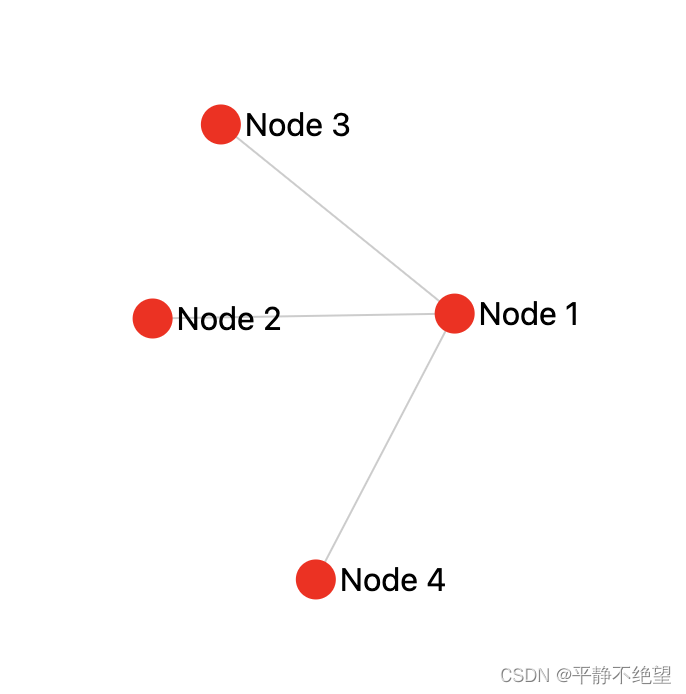
nodes: [
{id: 1, name: 'Node 1'},
{id: 2, name: 'Node 2'},
{id: 3, name: 'Node 3'},
{id: 4, name: 'Node 4'}
],
links: [
{source: 1, target: 2},
{source: 1, target: 3},
{source: 1, target: 4}
]
}
},
mounted() {
const svg = d3.select('#topology');
const width = svg.attr('width');
const height = svg.attr('height');
const simulation = d3.forceSimulation(this.nodes)
.force('link', d3.forceLink(this.links).id(d => d.id).distance(150))
.force('charge', d3.forceManyBody())
.force('center', d3.forceCenter(width / 2, height / 2));
const link = svg.selectAll('line')
.data(this.links)
.enter()
.append('line')
.attr('stroke', '#ccc')
.attr('stroke-width', 1);
const node = svg.selectAll('circle')
.data(this.nodes)
.enter()
.append('circle')
.attr('r', 10)
.attr('fill', 'red')
.call(d3.drag()
.on('start', dragstarted)
.on('drag', dragged)
.on('end', dragended));
const label = svg.selectAll('.label')
.data(this.nodes)
.enter()
.append('text')
.attr('class', "label")
.text(function (d) {return d.name;})
.attr("dx", 12)
.attr("dy", ".35em");
node.append('title')
.text(d => d.name);
simulation.on('tick', () => {
link
.attr('x1', d => d.source.x)
.attr('y1', d => d.source.y)
.attr('x2', d => d.target.x)
.attr('y2', d => d.target.y);
node
.attr('cx', d => d.x)
.attr('cy', d => d.y);
label
.attr('x', function (d) {return d.x;})
.attr('y', function (d) {return d.y;});
});
function dragstarted(event, d) {
if (!event.active) simulation.alphaTarget(0.1).restart();
d.fx = d.x;
d.fy = d.y;
}
function dragged(event, d) {
d.fx = event.x;
d.fy = event.y;
}
function dragended(event, d) {
if (!event.active) simulation.alphaTarget(0);
d.fx = null;
d.fy = null;
}
}
}
</script>
本文转载自: https://blog.csdn.net/qfzhangwei/article/details/129911666
版权归原作者 平静不绝望 所有, 如有侵权,请联系我们删除。
版权归原作者 平静不绝望 所有, 如有侵权,请联系我们删除。