
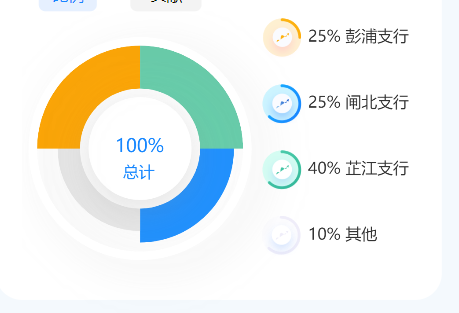
环形图
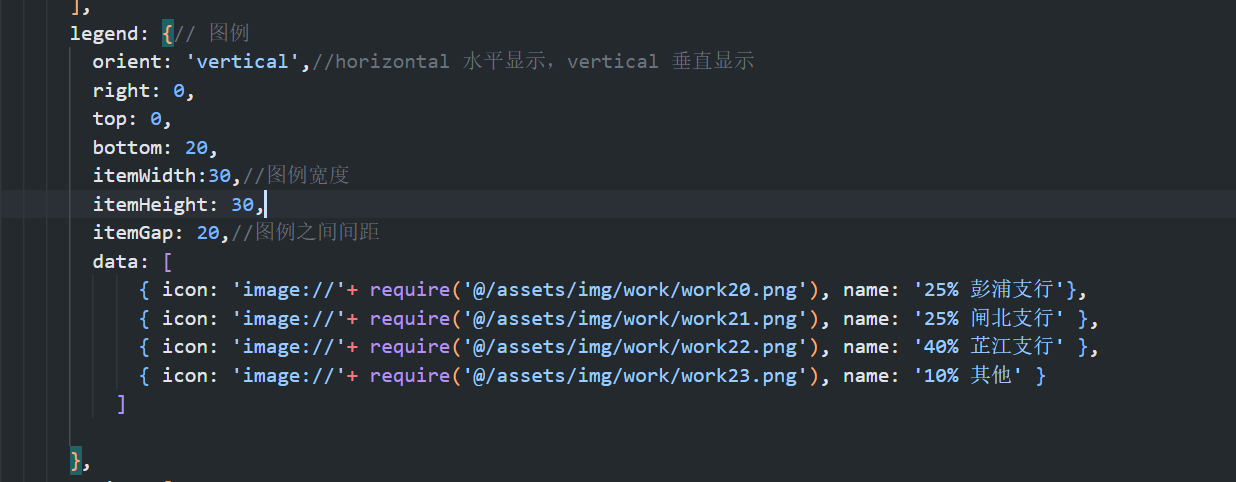
修改图例自定义icon
完整代码图
  Chart1() { // 折算价值户新增构成
      let chartDom = document.getElementById('main');
      let myChart = this.$echarts.init(chartDom);
      let option;
      option = {
        // 设置占比图颜色
        color:['#FFA500','#66CDAA','    #1E90FF','    #E8E8E8'],
        tooltip: { //提示框
          trigger: 'item',
          formatter: '{b} : <br/> {c} ({d}%)'
        },
        title:[ // 中心换行标题
          {
            text: "总计",
            left: '24%',
            top: '43%',
            textStyle: {
              color: 'black',
              fontSize: 12,
              fontWeight: "400",
              color:'#1787ff'
            }
          },
          {
            text: '100%',
            left: '22%',
            top: '35%',
            textStyle: {
              color: 'black',
              fontSize: 14,
              fontWeight: "400",
              color:'#1787ff',
              fill: 'red',
            }
          }
        ],
        legend: {// 图例
          orient: 'vertical',//horizontal 水平显示,vertical 垂直显示
          right: 0,
          top: 20,
          bottom: 20,
          itemWidth:10,//图例宽度
          itemHeight: 10,
          itemGap: 35,//图例之间间距
        },
        series: [
          {
            name: '占比',
            startAngle: 180,
            label: {// 点击展示方式
              show: false,
            },
            type: 'pie',
            radius: ['35%', '60%'],// 饼图大小设置
            roseType: 'area',
            avoidLabelOverlap: true,// 是否启用防止标签重叠策略
            labelLine: { // z折线连接的标题
              show: false
            },
            center: ['30%', '40%'],//饼图位置
            data: [
              { value: 735, name: '25% 彭浦支行' },
              { value: 735, name: '25% 闸北支行' },
              { value: 580, name: '40% 芷江支行' },
              { value: 384, name: '10% 其他' }
            ]
          },
          {
            name:'中心圆',
            radius: ['0%', '30%'],
            center: ['30%', '40%'],
            type: 'pie',
            color:"white",  //内圆颜色
            itemStyle: {
              normal: {
                // 设置阴影
                shadowBlur: 30,
                shadowColor: 'rgba(147, 147, 147,0.3)',
                shadowOffsetX: 0,
                shadowOffsetY: 7
              }
            },
            label: {
              normal: {
                  show: false
              },
              emphasis: {
                  show: false
              }
            },
            labelLine: {
                normal: {
                  show: false
                },
                emphasis: {
                  show: false
                }
            },
            animation: false,
            tooltip: {
              show: false
            },
            data: [{
              value: 1,
            }],
        },
        {
          name: '外边框',
          type: 'pie',
          color:"white",  //内圆颜色
          clockWise: false, //顺时加载
          hoverAnimation: false, //鼠标移入变大
          center: ['30%', '40%'],
          radius: ['60%', '65%'],
          itemStyle: {
            normal: {
              // 设置阴影
              shadowBlur: 30,
              shadowColor: 'rgba(147, 147, 147,0.3)',
              shadowOffsetX: 10,
              shadowOffsetY: 7
            }
          },
          label: {
            normal: {
                show: false
            }
          },
          data: [{
            value: 9,
            name: '',
            itemStyle: {
                normal: { //可以设置样式
                  // borderWidth: 2,
                  // borderColor: '#2ec7c9'
                }
            }
          }]
        },
        ]
      };
      option && myChart.setOption(option);
    },
柱状图
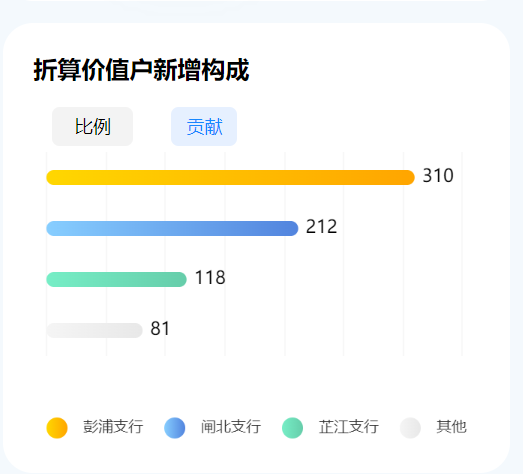
Chart2(){
      let chartDom = document.getElementById('main2');
      let myChart = this.$echarts.init(chartDom);
      let category = ['彭浦支行', '闸北支行', '芷江支行', '其他'];
      // let barData = [310, 212, 118, 81];
      let option;
      option = {
        tooltip: {
          trigger: 'item',
        },
        legend: {
          x:'center',
          y:'bottom',
          icon: "circle", // 修改形状
          temHeight: 1, // 修改icon图形大小
          itemGap: 14, // 修改间距
          textStyle: {
            fontSize: 10,
            color: "#333",
          },
        },
        grid: {
          left: '3%',
          right: '4%',
          top: '2%',
          containLabel: false
        },
        xAxis: {
          type: 'value',
          axisLine: {
            show: false
          },
          axisTick: {
            show: false
          },
          axisLabel: {
            show: false
          },
          splitLine:{ // 背景线条
            show:true,
            lineStyle:{
              color:'    #d6d6d6',
              width:0.2,// 线条宽
            }
          }
        },
        yAxis: [
          {
            type: 'category',
            show:false,
            inverse:true,
            data: category,
            axisLine: {
              show: false
            },
            axisTick: {
              show: false
            }
          },
       ],
        series: [
        {
          name: '彭浦支行',
          data: [310, null, null,  null],
          type: 'bar',
          barWidth:10,// 柱子宽度
          stack: 'Mon',
          itemStyle: {
            normal: {
              barBorderRadius: 17,
              color: new this.$echarts.graphic.LinearGradient(0, 0, 1, 0, [
              {
                offset: 0,
                color: '#FFD700'
              }, {
                offset: 1,
                color: '#FFA500'
              }]),
            },
          },
          label: {
            show: true,
            position: 'right',
            formatter: '{c}',
          }
        },
        {
          name: '闸北支行',
          data: [null, 212, null,  null],
          type: 'bar',
          stack: 'Mon',
          itemStyle: {
            normal: {
              barBorderRadius: 17,
              color: new this.$echarts.graphic.LinearGradient(0, 0, 1, 0, [
              {
                offset: 0,
                color: '#87CEFF'
              }, {
                offset: 1,
                color: '#5284DE'
              }]),
            }
          },
          label: {
            show: true,
            position: 'right',
            formatter: '{c}',
          }
        },
        {
          name: '芷江支行',
          data: [null, null, 118, null],
          type: 'bar',
          stack: 'Mon',
          itemStyle: {
            normal: {
              barBorderRadius: 17,
              //这里是颜色
              color: new this.$echarts.graphic.LinearGradient(0, 0, 1, 0, [
              {
                offset: 0,
                color: '#76EEC6'
              }, {
                offset: 1,
                color: '#66CDAA'
              }]),
            }
          },
          label: {
            show: true,
            position: 'right',
            formatter: '{c}',
          }
        },
        {
          name: '其他',
          data: [null, null, null,  81],
          type: 'bar',
          stack: 'Mon',
          itemStyle: {
            normal: {
              barBorderRadius: 17,
              //这里是颜色
              color: new this.$echarts.graphic.LinearGradient(0, 0, 1, 0, [
              {
                offset: 0,
                color: '#F5F5F5'
              }, {
                offset: 1,
                color: '#E8E8E8'
              }]),
            }
          },
          label: {
            show: true,
            position: 'right',
            formatter: '{c}',
          }
        },
        ]
      };

      option && myChart.setOption(option);
    },
半圆图
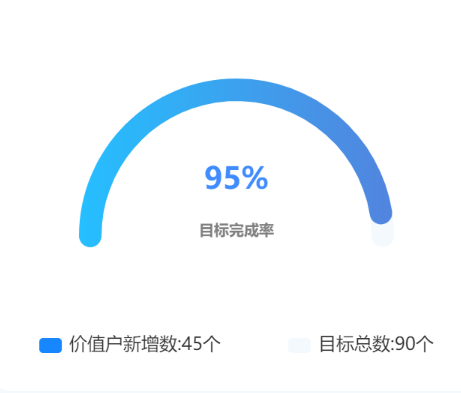
Chart3(){
      let chartDom = document.getElementById('main3');
      let myChart = this.$echarts.init(chartDom);
      let option;
      // 进度百分比
      let value = 95
      option = {
        title: [{
            text: value + '%',
            left: 'center',
            top: '40%',
            textStyle: {
              color: 'rgba(64, 140, 255, 1)',
              fontSize: 20
            }
        }, {
            text: '目标完成率',
            left: 'center',
            top: '55%',
            textStyle: {
              color: 'black',
              fontSize: 10,
              color:'grey'
            }
        }],
        legend: {
          bottom:'20',
          itemWidth:15,
          itemHeight: 10,
          itemGap: 45,//图例间距
          data: ["价值户新增数:45个", "目标总数:90个", ],
        },
        angleAxis: {
          show: false,
          // 后面的180表示圆环的跨越的角度, 如max设置为100*360/270,startAngle设置为-135
          max: 100 * 360 / 180,
          type: 'value',
          startAngle: 180,
          splitLine: {
            show: false
          }
        },
        // 修改环形的宽度
        barMaxWidth: 15,
        radiusAxis: {
          show: false,
          type: 'category'
        },
        polar: {
          // 设置环形的位置
          center: ['50%', '60%'],
          // 设置环形大小
          radius: '150%'
        },
        series:[
          {
            name:'价值户新增数:45个',
            color: 'rgba(23, 135, 255, 1)',
            type: 'bar',
            roundCap: true, // 开启圆角
            data: [
              {
                value: value,
                itemStyle: {
                  normal: {
                    opacity: 1,
                    color: new this.$echarts.graphic.LinearGradient(0, 0, 1, 0, [
                      {
                        offset: 0,
                        color: '#25BFFF'
                      }, {
                        offset: 1,
                        color: '#5284DE'
                      }]),
                    shadowColor: '#2A95F9'
                  }
                }
              }
            ],
            barGap: '-100%',
            coordinateSystem: 'polar',
            z: 3
        }, {
            name:'目标总数:90个',
            color: 'rgba(244, 249, 253, 1)',
            type: 'bar',
            roundCap: true,// 开启圆角
            data: [{
                value: 100,
                itemStyle: {
                  // 这里是环形底色
                  color: 'rgba(244, 249, 253, 1)',
                  borderWidth: 0
                }
            }],
            barGap: '-100%',
            coordinateSystem: 'polar',
            z: 1
        }]
      }
      option && myChart.setOption(option);

    },
折线图
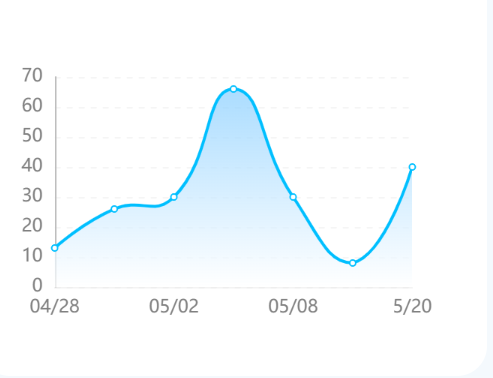
Chart4() {
      let chartDom = document.getElementById('main4');
      let myChart = this.$echarts.init(chartDom);
      let option;
      option = {
        tooltip: { //提示框
       //触发类型;轴触发,axis则鼠标hover到一条柱状图显示全部数据,item则鼠标hover到折线点显示相应数据,
          trigger: 'item',
          formatter:'{b}<br/>价值户新增:{c}',
        },
        xAxis: {
          type: 'category',
          boundaryGap: false,// 坐标轴两边是不是留白
          data: ['04/28', '04/30', '05/02', '05/04','05/08','05/10','5/20'],
          axisLine: {//坐标系
            show: true,
            lineStyle:{ //x坐标系字体样式
              color:'#E8E8E8',
              width:0.5
            }
          },
          axisLabel: {
            interval:1,//0代表显示所有x轴标签显示,1不显示全
            color:'grey'//x轴字体颜色
          },
          axisTick: { // 刻度线
            show: false,
          },
        },
        yAxis: {
          type: 'value',
          axisLabel:{//字体
            color:'grey'
          },
          axisLine: {//y轴线
            show: true,
            lineStyle:{
              color:'#BEBEBE'
            }
          },
          axisTick: {//y刻度线
              show: false
          },
          splitLine: { // 背景线 分割线
            show: true,
            lineStyle:{
              type:'dashed',
              color:'    #F5F5F5'
            }
          }
        },
        series: [
          {
            data: [13, 26, 30, 66, 30,8,40],
            type: 'line',
            smooth: true,//显示平滑曲线
            lineStyle:{
              color:'#00BFFF' //折线颜色
            },
            itemStyle : { //折线点颜色
              normal : {
                color:'#00BFFF'
              }
            },
            areaStyle: { //区域渐变色
              normal: {
                color: new this.$echarts.graphic.LinearGradient(0, 0, 0, 1, [
                  {
                    offset: 0,
                    color: '#87CEFF'
                  }, {
                    offset: 1,
                    color: '#ffffff'
                  }
                ]),
              }
            },
          }
        ]
      };

      option && myChart.setOption(option);

    }
本文转载自: https://blog.csdn.net/weixin_54368936/article/details/129124934
版权归原作者 西洛.sco 所有, 如有侵权,请联系我们删除。
版权归原作者 西洛.sco 所有, 如有侵权,请联系我们删除。