From:新中地
1.简介
智慧机场解决方案,基于数字化大平台,融合AI、大数据、IoT、视频云、云计算等技术,围绕机场“运控、安防、服务”三大业务领域,构建“出行一张脸”及“运行一张图”两大场景化解决方案。
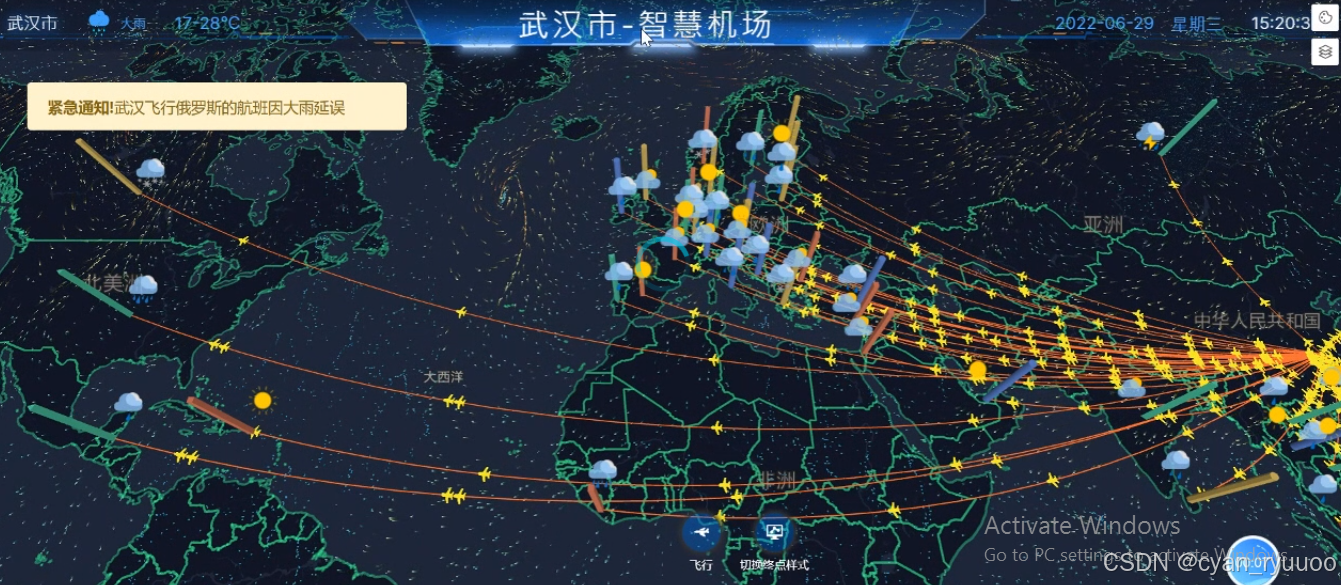
https://gitee.com/iGaoWei/big-data-viewhttps://github.com/antvis/L7BigDataView: 100+套大数据可视化炫酷大屏Html5模板;包含行业:社区、物业、政务、交通、金融银行等,全网最新、最多,最全、最酷、最炫大数据可视化模板。陆续更新中https://gitee.com/iGaoWei/big-data-viewGitHub - antvis/L7: 🌎 Large-scale WebGL-powered Geospatial Data Visualization analysis engine.🌎 Large-scale WebGL-powered Geospatial Data Visualization analysis engine. - antvis/L7https://github.com/antvis/L7L7 - AntVL7 中的 L 代表 Location,7 代表世界七大洲,寓意能为全球位置数据提供可视化能力。L7 的目标是提供一套地理空间数据可视化框架,易用易扩展,支持海量数据的高性能和 3D 高质量渲染,安全可靠的地理空间数据可视化解决方案。https://antv-2018.alipay.com/zh-cn/l7/1.x/index.html
L7 是由蚂蚁金服 Antv 数据 可视化团队推出的基于 webGL的开源大规模 地理空问数据 可化视分析开发框架。
L7中的L代表 Location ,7 代表世界七大洲 ,寓意能为 全球位置 数据提供可视分析的能力。L7 专注数据可视化化表达,通过颜色、大小、纹理,方向,体积等视觉变量设置实现从数据到信息清晰,有效的表达。
L7 能够满足常见的地图图表,B1系统的可视化分析、以及 GIS,交通,电力,国土农业,城市等领域的空间信息管理,分析等应用系统开发需求。
核心特性
- 数据驱动可视化展示
数据驱动,灵活数据映射,从数到形,支持丰富的地图可视化类型,更好洞察数据。、
- 2D,3D 一体化的海量数据高性能渲染
海量空间数据实时,可交互,动态渲染
- 简单灵活的数据接入
支持 CSV,JSON,GeoJSON 等数据格式接入,可以根据需求自定义数据格式,无需复杂的空间数据转换。
- 多地图底图支持,支持离线内网部署
屏蔽不同底图之间的差异,用户只需要关注数据层表达,交互,高德地图国内合法合规的地理底图,Mapbox满足国际化业务需求。
支持丰富的图表类型
点图层 : 气泡图 散点图 符号地图 3D 柱状地图
线图层 : 路径地图 弧线(支持 2D 弧线、3D 弧线以及大圆航线) 等值线
面图层 : 填充图
热力图 : 经典热力图
2.简单使用L7
快速上手 · 语雀
快速上手 | AntV L7 地理空间数据可视化引擎
2.1 安装cdn
<script src="https://unpkg.com/@antv/l7'></script>
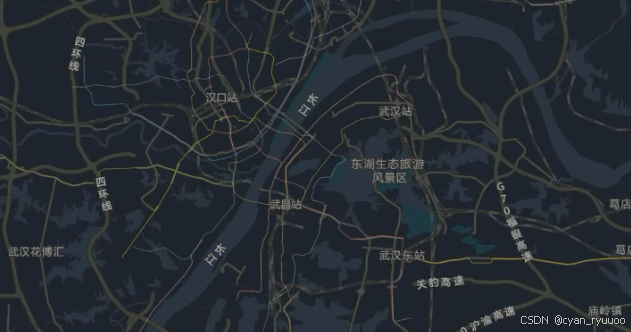
2.2 初始化地图
按住鼠标右键 上下拖动地图, 或者ctrl+ 左键
    <!--2、设置L7地图的挂载点-->
    <div id="map">
    </div>
<script>
    /*3、实例化场景*/
    const scene = new L7.Scene({
    /*通过id将实例化的场景挂载到对应的DOM元素之上*/
        id: "map",
        map: new L7.GaodeMap({
            style: "dark",
            center:[114.30,30.50],
            zoom: 14,
            pitch: 0, // 0-90 地图俯仰角
        })
    })
</script>
2.3 Scene参数解释及控件
Scene 属性 配置项
Scene基础的地图类,提供地图创建,图层创建,管理等功能
- L7 侧重于地理数据的可视化表达
- 地图层需要依赖第三方地图,第三方地图通过 Scene的 map 属性 统一创建
  const scene = new L7.Scene({
        id: "map", // 设置实例场景的挂载点
        map: new L7.GaodeMap({ // map 地图配置项
            style: "dark", // 地图样式 dark|light |normal|blank
            center:[114.30,30.50], // 设置中心点
            zoom: 14, // 放大级别
            minZoom: 14, // 地图最小缩放等级 0~22
            maxZoom: 14, // 地图最大缩放等级 0~22
            pitch: 0, // 俯仰角
        }),
        logoVisible: false, // 控制logo的显示和隐藏
    })

// 需求添加自定义的logo控件
scene.on("loaded",()=>{
    const logo = new L7.Logo({
        // 图片 url
        img: 'https://img.gejiba.com/images/dfdb6db1623eb881e724f58d9a366af8.jpg',
        //跳转地址
        href:"http://www.baidu.com/",
        position:"bottomright"
    })
    scene.addControl(logo);
    /*设置地图主题控件*/
    const mapTheme = new L7.MapTheme({})
    scene.addControl(mapTheme)
})
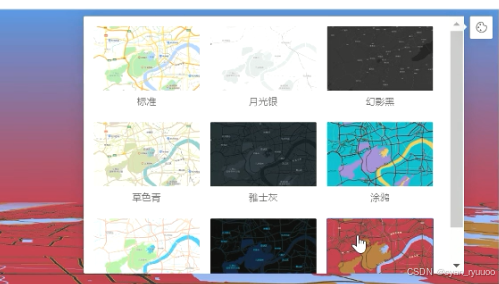
目前 L7 支持多种地图底图
- 高德地图 国内业务场景 合规中国地图
- MapBox 国际业务,或者内网离线部署场景
2.4 地图操作
2.4.1、切换底图
setMapStyle(style:string): void 设置地图样式
需求:点击事件控制图层的切换
let isToggle = false;
/*给地图绑定点击事件*/
scene.on("loaded",()=>{
    scene.on("click" ,()=>{
        isToggle = !isToggle
        if(isToggle) {
            scene.setMapStyle("normal")
        } else {
            scene.setMapStyle("dark")
        }
    })
})
2.4.2 放大缩小地图
scene.getZoom() 获取缩放级别
scene.setZoom() 设置缩放级别
scene.zoomIn() 放大
scene.zoom0ut() 缩小
scene.getCenter() 获取中心点
scene.setCenter([lng, lat]) 设置中心点
scene.setZoomAndCenter(zoom,center) 设置缩放级别和中心点
需求: 放大 缩小 地图按钮
    <!--2、设置L7地图的挂载点-->
    <div id="map">
    </div>
    <!--需要设置样式显示-->
    <button oncClick="addMap()"> 放大 </button>
    <button oncClick="reduceMap()"> 缩小 </button>
<script>
    /*3、实例化场景*/
    const scene = new L7.Scene({
    /*通过id将实例化的场景挂载到对应的DOM元素之上*/
        id: "map",
        map: new L7.GaodeMap({
            style: "dark",
            center:[114.30,30.50],
            zoom: 14,
            pitch: 0, // 0-90 地图俯仰角
        })
    })
    function addmap() {
        let zoom = scene.getZoom()
        scene.setZoom( zoom + 1 )
    }
    function reduceMap() {
        let zoom = scene.getZoom()
        scene.setZoom( zoom - 1 )
    }
</script>
3.点图层
点图层3D柱状图 - AntV
3.1 造数据
应该是这个网址 不过我没打开
L7 Editor - 基于 L7 的地理数据绘制工具
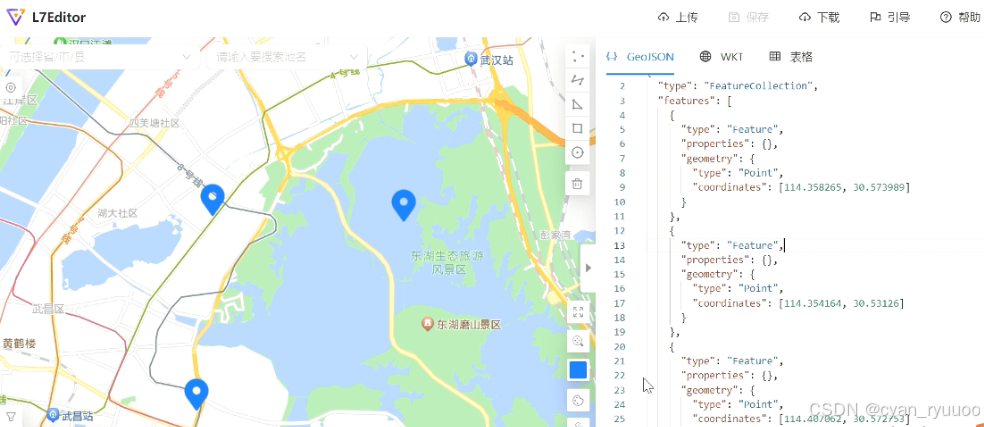
造出点数据 复制到项目
3.2 点击图层Popup弹框

var data = {
  "type": "FeatureCollection",
  "features": [
    {
      "type": "Feature",
      "properties": {
        "height": 10,
        "name" : "武昌",
        },
      "geometry": {
        "type": "point",
        "coordinates": [110.478515625, 32.76880048488168],
      }
    }
  ]
}

scene.on('loaded', () => {
    // 点图层
     const pointLayer = new L7.PointLayer({})
     pointLayer.source(data) // 设置图层数据
        .shape('simple')
        .size('height', h => {
                return h
            }) // 大小  height是读取数据的properties height
        .color('mag', mag =>  mag > 4.5 ? '#5B8FF9' : '#5CCEA1';) // 设置图层颜色
        .style({ // 样式
          opacity: 0.6,
          strokeWidth: 3 // 描边
        })
        .active(true) // 设置鼠标悬浮颜色
      scene.addLayer(pointLayer);
      pointLayer.on("click" , evt => {
        let {name } = evt.features.properties
        let popup = new L7.Popup({
            lngLat: evt.lngLat,
            html: `<p>${name}</p>`
        })
        scene.addPopup(popup)
      })
});
3.3 散点动画

var data = {
  "type": "FeatureCollection",
  "features": [
    {
      "type": "Feature",
      "properties": {
        "height": 10,
        "name" : "武昌",
        },
      "geometry": {
        "type": "point",
        "coordinates": [110.478515625, 32.76880048488168],
      }
    },
    {
      "type": "Feature",
      "properties": {
        "height": 20,
        "name" : "汉阳",
        },
      "geometry": {
        "type": "point",
        "coordinates": [110.479, 32.770],
      }
    }
  ]
}

scene.on('loaded', () => {
    // 点图层
     const pointLayer = new L7.PointLayer({})
     pointLayer.source(data) // 设置图层数据
        .shape('circle')
        .size('height', h => {
                return h * 2
            })
        .color('ff2d51')
        .animate(true) // 设置动画
      scene.addLayer(pointLayer);
});
3.4 3D柱状图
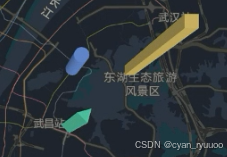
var data = {} // 省略数据
scene.on('loaded', () => {
    // 点图层
     const pointLayer = new L7.PointLayer({
            zIndex: 6 // 可以设置图层堆叠顺序
        })
     pointLayer.source(data)
    .shape('name', [ 'cylinder', 'triangleColumn', 'hexagonColumn', 'squareColumn' ])
    .color('name', [ '#739DFF', '#61FCBF', '#FFDE74', '#FF896F' ]);
    .size('height', h => [ 10, h ])
    .active(true)
    .animate(true)
    scene.addLayer(pointLayer);
});
3.5 符号地图

需求 : 根据 properties 中w值的不同显示不同天气
var data = {} // 省略数据  properties 里面有w:

const weather_icon = [
    {
        type: "0-天晴",
        url: "https://gw.alipayobjects.com/mdn/antv_site/afts/img/A*kzTMQqS2QdUAAAAAAAAAAABKARQnAQ"
    },
    {
        type: "1-多云",
        url: "https://gw.alipayobjects.com/mdn/antv_site/afts/img/A*jH1XRb7F7hMAAAAAAAAAAABkARQnAQ"
    },
    {
        type: "2-小雨",
        url: "https://gw.alipayobjects.com/mdn/antv_site/afts/img/A*DccRTI6ZRLoAAAAAAAAAAABkARQnAQ"
    },
]

scene.on('loaded', () => {
    /*实现icon的设置*/
    weather_icon.forEach( item =>{
        let type = Number(item.type.split("-")[0])
        scene.addImage(type,item.url)
    })

    // 点图层
     const pointLayer = new L7.PointLayer()
     pointLayer.source(data)
    .shape('w' , w => w)
    .size(20)
    scene.addLayer(pointLayer);
});
4.线图层
4.1 普通线
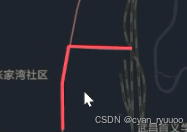
var data = {
  "type": "FeatureCollection",
  "features": [
    {
      "type": "Feature",
      "properties": {
        },
      "geometry": {
        "type": "LineString",
        "coordinates": [
            [114.292975,30.488542],
            [114.29292,30.493947],
            [114.293779,30.498206],
            [114.299404,30.498846],
            [114.302326,30.497993]
        ]
      }
    }
  ]
}

scene.on('loaded', () => {
    // 线图层
     const lineLayer = new L7.LineLayer({})
     lineLayer.source(data) // 设置图层数据
        .shape('line')
        .size(2)
        .color('ff2d51')
      scene.addLayer(lineLayer);
});
4.2 中国、 全球边界数据
http://39.103.151.139:8000/gis/china
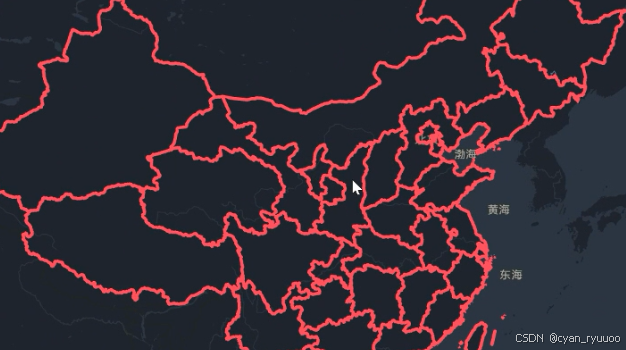

scene.on('loaded', () => {
    // 这里就是请求数据  教学中是将json下载放在data下 引入jquery依赖
    $.ajax({
        url:"/data/中国.json"
    }).then(data =>{
        // 线图层
         const lineLayer = new L7.LineLayer({})
         lineLayer.source(data) // 设置图层数据
            .shape('line')
            .size(2)
            .color('ff2d51')
          scene.addLayer(lineLayer);
    })
})
4.3 线动画
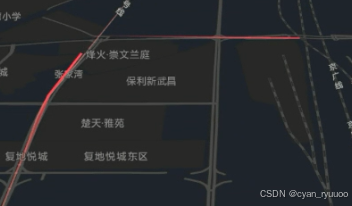
var data = {} // 上面有 省略

scene.on('loaded', () => {
    // 线图层
     const lineLayer = new L7.LineLayer({})
     lineLayer.source(data) // 设置图层数据
        .shape('line')
        .size(2)
        .color('ff2d51')
        .animate({
            trailLength: 1, // 流线长度
            interval: 0.25, // 设置间隔
            duration: 5 // 设置每段轨迹执行时间
        })
      scene.addLayer(lineLayer);
});
4.4 弧线动画
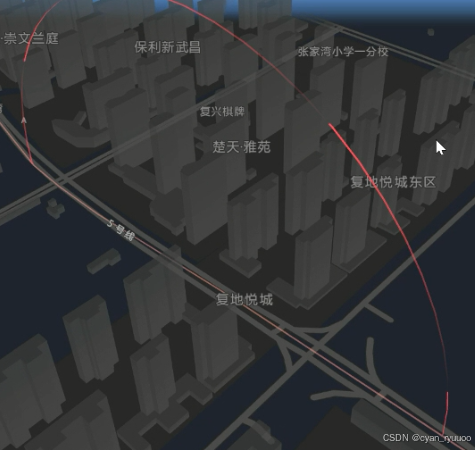
scene.on('loaded', () => {
    // 线图层
     const lineLayer = new L7.LineLayer({
        blend:"normal"
    })
     lineLayer.source(data) // 设置图层数据
        .shape('arc3d')
        .size(2)
        .color('ff2d51')
        .animate({
            trailLength: 1, // 流线长度
            interval: 0.25, // 设置间隔
            duration: 5 // 设置每段轨迹执行时间
        })
      scene.addLayer(lineLayer);
});
4.5.航线图

scene.addImage(
    'plane',
    'https://gw.alipayobjects.com/zos/bmw-prod/0ca1668e-38c2-4010-8568-b57cb33839b9.svg')
scene.on('loaded', () => {
     const lineLayer = new L7.LineLayer({
        blend:"normal"
     })
     lineLayer.source(data) // 设置图层数据
        .shape('arc')
        .size(2)
        .color('ff2d51')
      scene.addLayer(lineLayer);

     const planLineLayer = new L7.LineLayer({
        blend:"normal",
        name: "飞机"
     })
     planLineLayer.source(data) // 设置图层数据
        .shape('arc')
        .size(15)
        .color('ff6b34')
        .texture('plane')
        .animate({
            trailLength: 0.05, // 流线长度
            interval: 0.25, // 设置间隔
            duration: 51 // 设置每段轨迹执行时间
        })
        .style({
            textureBlend: 'replace',
            lineTexture: true ,// 开启线的贴图功能
            iconStep: 10, // 设置贴图纹理的间距
        })
      scene.addLayer(planLineLayer);
});
5.拓展图层
5.1 风场
点击隐藏图层 再点击显示图层
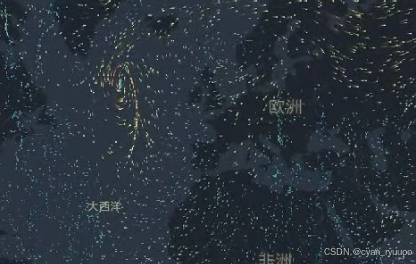
scene.on('loaded', () => {
     const windLayer = new L7.WindLayer({
        name:"风场"
     })
     windLayer.source(
'https://gw.alipayobjects.com/mdn/rms_23a451/afts/img/A*wcU8S5xMEDYAAAAAAAAAAAAAARQnAQ',
        {
          parser: {
            type: 'image',
            extent: [-180, -85, 180, 85],  // 用于设置风场图片作用到地图上的经纬图区间
          }
        }
     ) // 设置图层数据
        .animate(true)
        .style({
           numParticles: 35535,
           fadeOpacity: 0.9,
           sizeScale: 1.3,
           rampColors: {
                0.0:'#3288bd',
                0.1:'#66c2a5',
                0.2:'#abdda4',
                0.3:'#e6f598',
                0.4:'#fee08b',
                0.5:'#fdae61',
                0.6:'#f46d43',
                1.0:'#d53e4f'
           }
        })
      scene.addLayer(windLayer);
      scene.on("loaded",() => {
        scene.on("click",()=>{
            let layer = scene.getLayerByName("风场");
            var res = layer.isVisible() // isVisible 可以判断图层的显影
            if(res) {
                layer.hide()
            } else {
                layer.show();
            }
        })
    })
});
5.2 下雨点
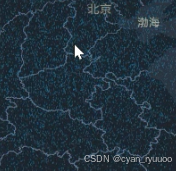
scene.on('loaded', () => {
    let rain = 'https://gw.alipayobjects.com/mdn/rms_816329/afts/img/A*w2SFSZJp4nIAAAAAAAAAAAAAARQnAQ',
     const layer = new L7.GeometryLayer({
        name:"暴雨点"
     })
     layer.shape('sprite')
        .size(10)
        .style({
            opacity: 0.3,
            mapTexture: rain,
            center: [120, 30],
            spriteCount: 12000,
            spriteRadius: 10,
            spriteTop: 2500000,
            spriteUpdate: 20000,
            spriteScale: 0.6,
        })
      scene.addLayer(layer);
});
5.3 根据天气不同显示不同数据

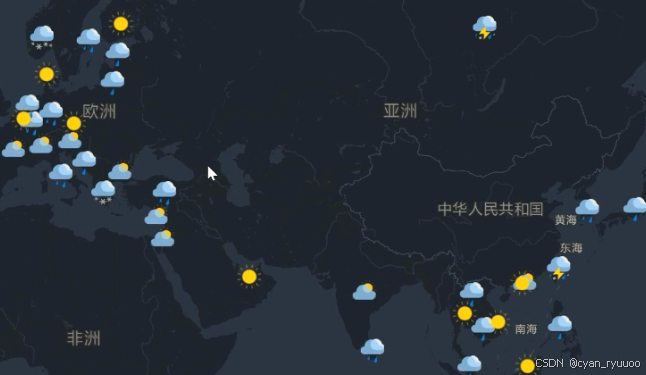
const water_icon = [] // 省略

scene.on('loaded', () => {
    water_icon.forEach(item => {
        scene.addImage(
            Number(item.type.split("-")[0]),
            item.url
        )
    })
    $.ajax({
        url:"/xxx.json"
    }).then(data => {
        let pointLayer = new L7.PointLayer({})
        pointLayer.source(data) // 设置图层数据
            .shape('weather')
            .size(15)
        scene.addLayer(layer);
    })

})
6. 综合项目
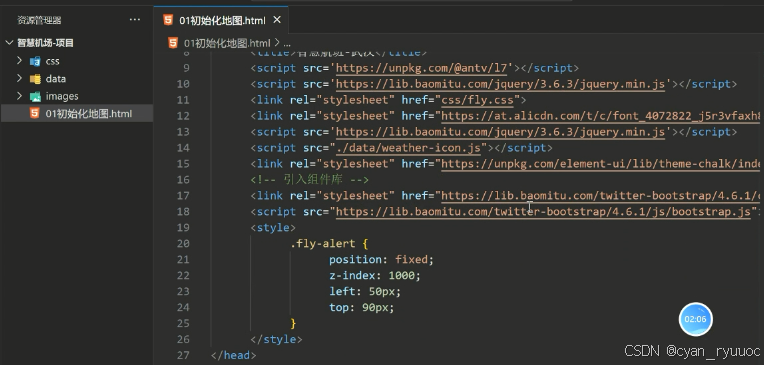
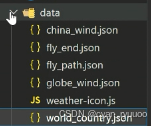
// 1.实现数据加载
scene.on('loaded', () => {
    Promise.all([
        /*全球数据*/
        $.ajax({
            url:"/data/world_country.json"
        })
        /*航班轨迹数据 */
        $.ajax({
            url:"/data/fly_path.json"
        })
        /*目的的数据 */
        $.ajax({
            url:"/data/fly_end.json"
        })
     ]).then(([world,fly_path,fly_end]) => {
            /* 1-1 加载全球数据 LineLayer*/
            const worldLayer= new L7.LineLayer({
                name:"world"
             })
            .source(world)
            .color("#41fc9d")
            .size(1)
            .style({
                opacity:0.4
            })
            scene.addLayer(worldLayer)
            /*1-2、加载飞行轨迹数据*/
            const flyLineLayer = new L7.LineLayer({
                name:"飞机轨迹"
            })
            .source(fly_path)
            .color("#ff6b34")
            .shape("arc")
            .size(1)
            scene.addLayer(flyLineLayer)
            // 实现飞行动画
            scene.addImage(
                'plane',
                'https://gw.alipayobjects.com/zos/bmw-prod/0ca1668e-38c2-4010-8568-b57cb33839b9.svg')
             const planLineLayer = new L7.LineLayer({
                blend:"normal",
                name: "飞机"
             })
             planLineLayer.source(fly_path) // 设置图层数据
                .shape('arc')
                .size(15)
                .color('ff6b34')
                .texture('plane')
                .animate({
                    trailLength: 0.05, // 流线长度
                    interval: 0.25, // 设置间隔
                    duration: 51 // 设置每段轨迹执行时间
                })
                .style({
                    textureBlend: 'replace',
                    lineTexture: true ,// 开启线的贴图功能
                    iconStep: 10, // 设置贴图纹理的间距
                })
              scene.addLayer(planLineLayer);
              /*1-3、加载终点数据*/
             const endLayer = new L7.PointLayer({
                zIndex: 6 ,// 可以设置图层堆叠顺序
                name:"终点"
            }).source(fly_end)
              .shape('name', [ 'cylinder', 'triangleColumn', 'hexagonColumn', 'squareColumn' ])
              .color('name', [ '#739DFF', '#61FCBF', '#FFDE74', '#FF896F' ]);
              .size([4, 100]) // 半径 高度
              .active(true)
              .animate(true)
            scene.addLayer(endLayer);

            //2、根据终点的天气不同,显示不同图片
            water_icon.forEach(item => {
                scene.addImage(
                    Number(item.type.split("-")[0]),
                    item.url
                )
            })
            const weather_layer = new L7.PointLayer({
                name: "天气图层"
            }).source(fly_end) // 设置图层数据
              .shape('weather')
              .size(15)
              .style({
                  offsets: [0,30]
                })
            scene.addLayer(weather_layer);

            // 风场
            const windLayer = new L7.WindLayer({
                name:"风场"
             })
             windLayer.source(
'https://gw.alipayobjects.com/mdn/rms_23a451/afts/img/A*wcU8S5xMEDYAAAAAAAAAAAAAARQnAQ',
                {
                  parser: {
                    type: 'image',
                    extent: [-180, -85, 180, 85],  // 用于设置风场图片作用到地图上的经纬图区间
                  }
                }
             )
                .animate(true)
                .style({
                   numParticles: 35535,
                   fadeOpacity: 0.9,
                   sizeScale: 1.3,
                   rampColors: {
                        0.0:'#3288bd',
                        0.1:'#66c2a5',
                        0.2:'#abdda4',
                        0.3:'#e6f598',
                        0.4:'#fee08b',
                        0.5:'#fdae61',
                        0.6:'#f46d43',
                        1.0:'#d53e4f'
                   }
                })
                scene.addLayer(windLayer);

                /*图层控制器*/
                setTimeout(()=>{
                    const layerSwitch = new L7.LayerSwitch({
                        layers:scene.getLayers()
                    })
                    scene.addControl(layerSwitch)
                },500)

                /*地图放大zoom>3风场隐藏 */
                scene.on("mapmove",() => {
                    let layer = scene.getLayerByName("风场");
                    let zoom = scene.getZoom();
                    if(zoom > 3){
                        layer.hide();
                    } else {
                        layer.show()
                    }
                })

                /*实现暴雨点 */
                let rain = 'https://gw.alipayobjects.com/mdn/rms_816329/afts/img/A*w2SFSZJp4nIAAAAAAAAAAAAAARQnAQ',
                 const layer = new L7.GeometryLayer({
                    name:"暴雨点"
                 }).shape('sprite')
                    .size(10)
                    .style({
                        opacity: 0.3,
                        mapTexture: rain,
                        center: [120, 30],
                        spriteCount: 12000,
                        spriteRadius: 10,
                        spriteTop: 2500000,
                        spriteUpdate: 20000,
                        spriteScale: 0.6,
                    })
                  scene.addLayer(layer);
      })
})
// 点击消息提示 飞往暴雨点
function flyToRain(){
    scene.setZoomAndCenter(6,[105.318756,61.52401])
}
// 复位地图
function resetMap(){
    scene.setZoomAndCenter(origin_zoom,origin_center)
}
// 改变终点样式
function controlEnd(){
    let layer =scene.getLayerByName("终点");
    layer.shape("circle").size(30).color("#ffed11")
}
版权归原作者 cyan_ryuuoo 所有, 如有侵权,请联系我们删除。