
写到最前
   这段本想写到最后的,但是哥们为了多点粉丝把这个文章设置成了粉丝可见,所以在最前面这段我想谈一下我本人对当前国产信创要求以及ARM架构服务器的看法。

    总的来说我对国产信创ARM服务器这条技术路线持绝对乐观的态度。首先从服务器CPU算力来说目前鲲鹏CPU性能和迭代水平虽然和X86架构的CPU还有点差距但是我认为这个差距是段时间可以弥补的,另外从我的运维经验来说大部分客户场景下其实对CPU的使用率都不高,也就是说现在ARM架构的CPU基本完全能满足大部分客户的算力需求。从这次Mysql Sysbench测试来看两颗kunpeng920 48核心CPU的服务器在10张1000万数据的表下通过sysbench的oltp_read_write.lua来测试结果**tps约1.6****万qps****约33****万(最终性能瓶颈CPU,IOSP约5000,内存没跑满),**并且我不是搞数据库的,我认为经过专业DBA调试后这个数还可以更高,我在X86的测试环境中也测试过,基本和这个数据差不了多少。

    目前ARM架构下主要的阻力是中间件和应用软件,当前从CPU、虚拟化平台、操作系统、存储各个层面对ARM架构支持都是到位的,只要业务厂商进行软件适配,这个架构绝对可以满足绝大部分的客户的需求。

    我以前做过PowerLinux的推广,当前的ARM Linux可比当年的PowerLinux的处境好多了,有政策的支持、有厂商的投入、有更好的生态,所以我认为这条技术路线绝对是可以落地并发展的。
背景
 最近遇到一个客户想买服务器,但是在信创的大环境下底层硬件只有两条路线选择,一条是海光芯片为基础的超融合架构,另一种是ARM芯片为基础的传统服务器加存储架构。客户需要对两种架构进行压力测试进行比对,测试的方案定为Sysbench压力测试软件对FileIO和Mysql进行压力测试。

 本次我负责ARM芯片基础架构的测试,测试使用一台天宫服务器,配置为2颗Kunpeng 920-4826(48核心2600 MHz频率)内存128G,存储使用华为OceanstorDorado5600V6核心配置为1TBCache,11块3.8T NVME SSD Palm硬盘,RAID-TP,1块热备。服务器通过两块8GHBA卡直连存储。

- 操作系统以及配置
操作系统
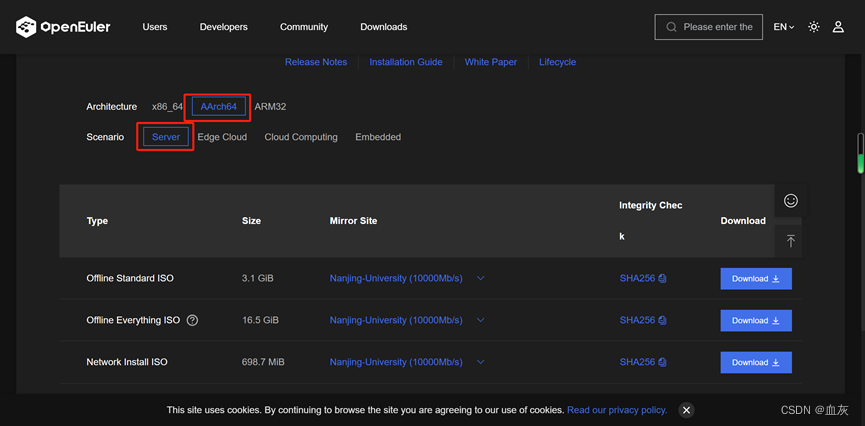
由于ARM的环境在客户现场,本次文档记录的环境我使用X86架构的服务器进行重新演示与操作。核心软件Sysbench与Mysql还有nmon使用源码安装,操作系统使用OpenEuler22.03SPH2。
Open Euler系统下载链接:
DownloadopenEuler is an open source, free Linux distribution platform. The platform provides an open community for global developers to build an open, diversified, and architecture-inclusive software ecosystem. openEuler is also an innovative platform that encourages everyone to propose new ideas, explore new approaches, and practice new solutions.https://www.openeuler.org/en/download/?version=openEuler%2022.03%20LTS%20SP2
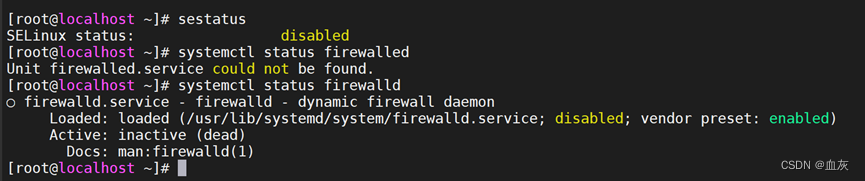
操作系统安装和IP地址配置此处省略,测试环境最好把selinux和firewalld关闭
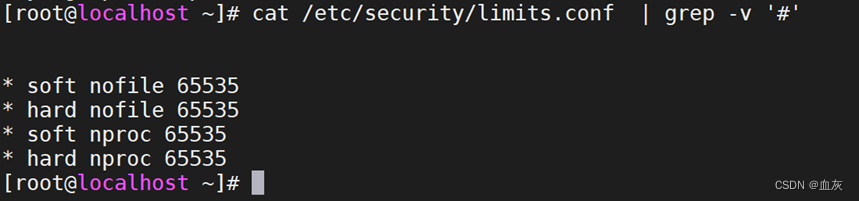
系统参数优化部分按照自身的环境具体分析,本次测试环境主要是修改了最大打开文件数这个参数,其他的设置基本没动。
vi /etc/security/limits.conf
End of file
soft nofile 65535
hard nofile 65535
soft nproc 65535
hard nproc 65535
vi /etc/sysctl.conf
fs.file-max=65535

Yum源配置
配置YUM源这里也不说了,公网源我比较喜欢清华大学的yum源
#generic-repos is licensed under the Mulan PSL v2.
#You can use this software according to the terms and conditions of the Mulan PSL v2.
#You may obtain a copy of Mulan PSL v2 at:
http://license.coscl.org.cn/MulanPSL2
#THIS SOFTWARE IS PROVIDED ON AN "AS IS" BASIS, WITHOUT WARRANTIES OF ANY KIND, EITHER EXPRESS OR
#IMPLIED, INCLUDING BUT NOT LIMITED TO NON-INFRINGEMENT, MERCHANTABILITY OR FIT FOR A PARTICULAR
#PURPOSE.
#See the Mulan PSL v2 for more details.
[OS]
name=OS
baseurl=https://mirrors.tuna.tsinghua.edu.cn/openeuler/openEuler-22.03-LTS/OS/$basearch/
enabled=1
gpgcheck=1
[everything]
name=everything
baseurl=https://mirrors.tuna.tsinghua.edu.cn/openeuler/openEuler-22.03-LTS/everything/$basearch/
enabled=1
gpgcheck=1
[EPOL]
name=EPOL
baseurl=https://mirrors.tuna.tsinghua.edu.cn/openeuler/openEuler-22.03-LTS/EPOL/main/$basearch/
enabled=1
gpgcheck=1
[debuginfo]
name=debuginfo
baseurl=https://mirrors.tuna.tsinghua.edu.cn/openeuler/openEuler-22.03-LTS/debuginfo/$basearch/
enabled=1
gpgcheck=1
[source]
name=source
baseurl=https://mirrors.tuna.tsinghua.edu.cn/openeuler/openEuler-22.03-LTS/source/
enabled=1
gpgcheck=1
gpgkey=https://mirrors.tuna.tsinghua.edu.cn/openeuler/openEuler-22.03-LTS/source/RPM-GPG-KEY-openEuler
[update]
name=update
baseurl=https://mirrors.tuna.tsinghua.edu.cn/openeuler/openEuler-22.03-LTS/update/$basearch/
enabled=1
gpgcheck=1
安装多路径软件:
UltraPaht下载链接:
华为 UltraPath 软件下载和补丁升级 - 华为UltraPath闪存存储:包括软件下载、补丁升级、HedEx文档、配置手册、案例、工具、产品公告、视频、论坛等内容。https://support.huawei.com/enterprise/zh/flash-storage/ultrapath-pid-8576127/software
由于本次操作系统使用OpenEuler 22.03在测试时(2023年12月)UltraPaht软件还没有对OpenEuler 22.03支持,所以测试使用的是Linux默认的Multipath ,安装就不说了,这里贴一下华为存储关于Multipath 的配置:
devices {
device {
vendor "HUAWEI"
product "XSG1"
path_grouping_policy multibus
path_checker tur
prio const
path_selector "round-robin 0"
failback immediate
dev_loss_tmo 30
fast_io_fail_tmo 5
no_path_retry 15
}
}
华为Dorado 5600V6存储关于linux Multipath 配置的相关链接:
https://support.huawei.com/enterprise/zh/doc/EDOC1100112792/814d66d3
NMON监控工具
源码安装nmon监控工具:
nmon监控工具是IBM为AIX研发的系统监控工具,可以通过源码安装的形式移植到Linux平台,源码下载地址:
nmon and njmon | Site / CompilingNmon https://nmon.sourceforge.io/pmwiki.php?n=Site.CompilingNmon
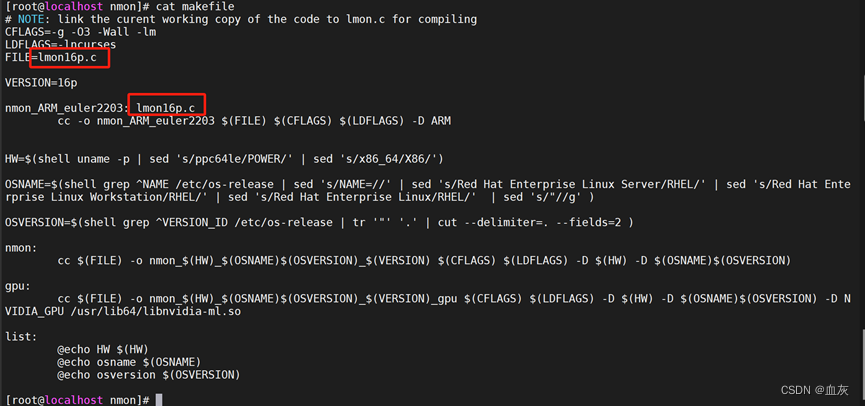
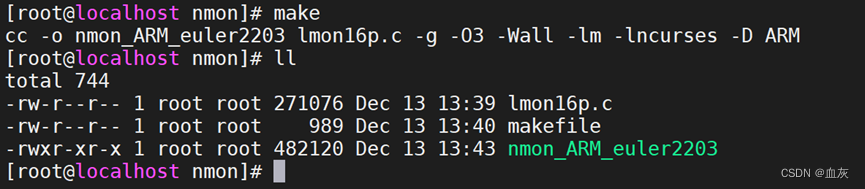
编辑makefile增加如下两行,并修改c文件的名称
nmon_ARM_euler2203: lmon16p.c
cc -o nmon_ARM_euler2203 $(FILE) $(CFLAGS) $(LDFLAGS) -D ARM
安装编译软件和相关软件
yum install make gcc gcc-c++ ncurses-dev*
执行make编译
make
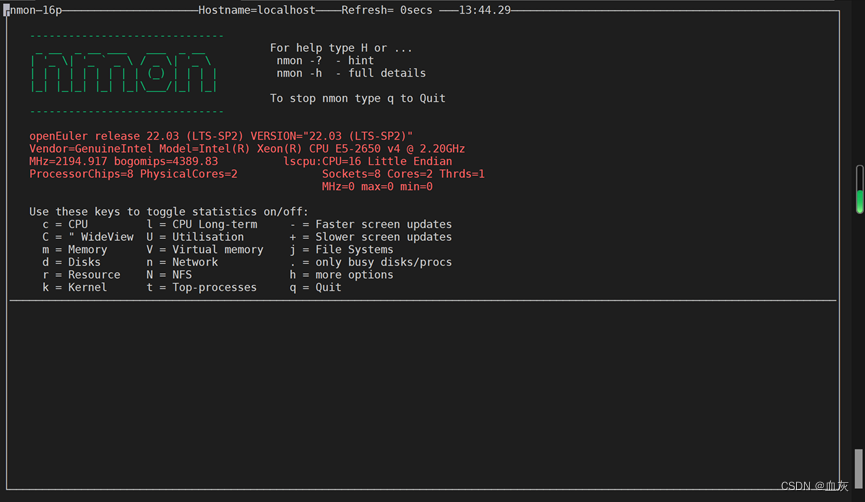
测试软件是否安装成功
./nmon_ARM_euler2203
新建软连接给系统添加nmon命令
ln -s /root/nmon/nmon_ARM_euler2203 /usr/bin/nmon

- Mysql*
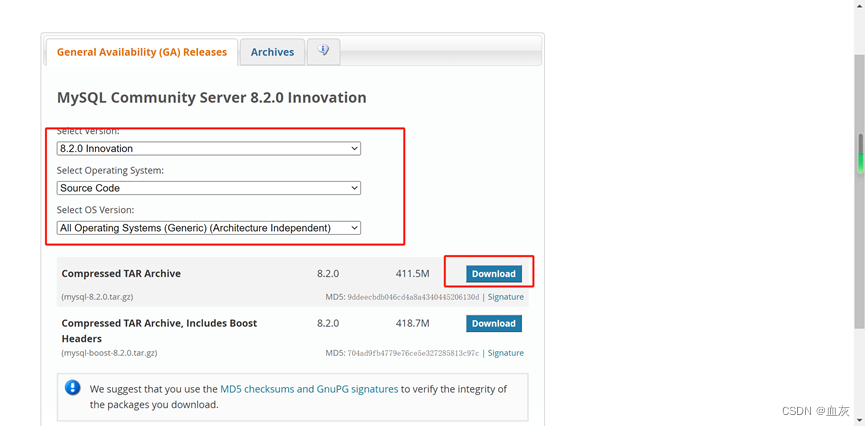
源码安装mysql:
Mysql源码下载地址:MySQL :: Download MySQL Community Server
下载boost软件,编译mysql时需要用到
https://boostorg.jfrog.io/artifactory/main/release/1.77.0/source/boost_1_77_0.tar.bz2
安装依赖工具:
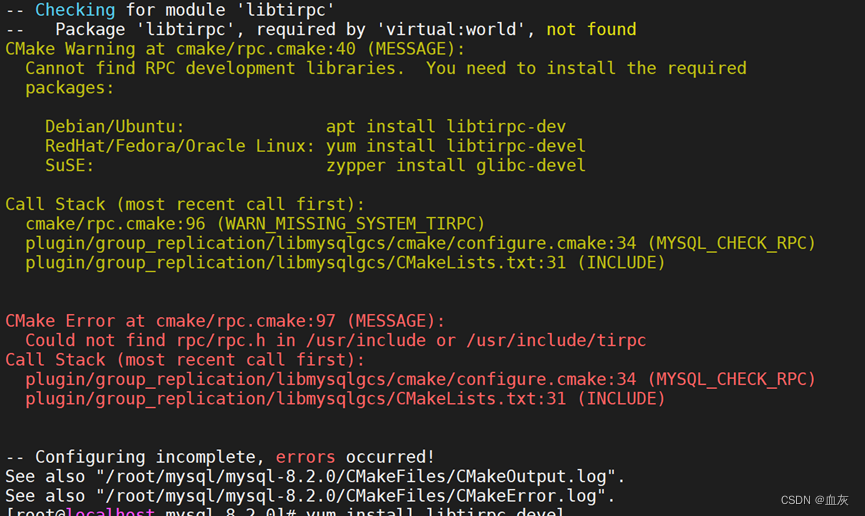
yum install gcc make gcc-c++ libxml2 libxml2-devel openssl openssl-devel bzip2 bzip2-devel curl-devel postgresql-devel libpng libjpeg-devel libjpeg libpng-devel freetype freetype-devel libicu-devel cmake ncurses-devel libzip libtirpc-devel rpcgen --skip-broken
里边有些冲突使用--skip-broken调过冲突软件
创建mysql用户和用户组
groupadd -r mysql
useradd -g mysql -s /sbin/nologin mysql

创建mysql安装目录和数据目录:
mkdir /data/mysql -p
mkdir /data/data
chown -R mysql:mysql /data/
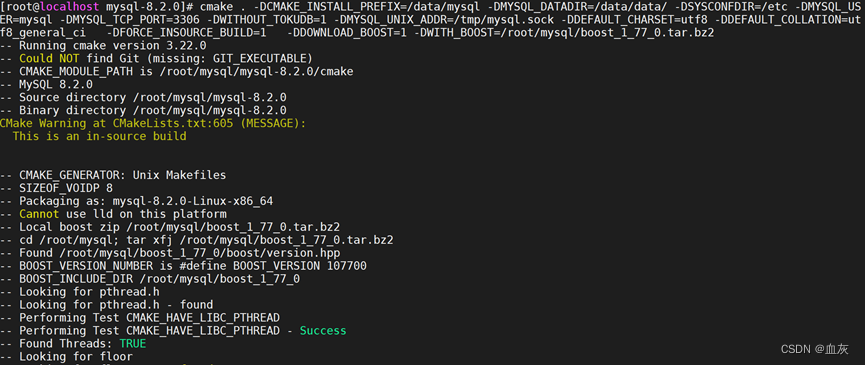
进入mysql解压后的目录执行预编译命令:
cmake . -DCMAKE_INSTALL_PREFIX=/data/mysql -DMYSQL_DATADIR=/data/data/ -DSYSCONFDIR=/etc -DMYSQL_USER=mysql -DMYSQL_TCP_PORT=3306 -DWITHOUT_TOKUDB=1 -DMYSQL_UNIX_ADDR=/tmp/mysql.sock -DDEFAULT_CHARSET=utf8 -DDEFAULT_COLLATION=utf8_general_ci -DFORCE_INSOURCE_BUILD=1 -DDOWNLOAD_BOOST=1 -DWITH_BOOST=/root/mysql/boost_1_77_0.tar.bz2
libtirpc-devel rpcgen 这两个软件本地yum源中估计没有需要提前下载好过程中可能会报如下错误,到时候手动rpm或者yum安装好即可
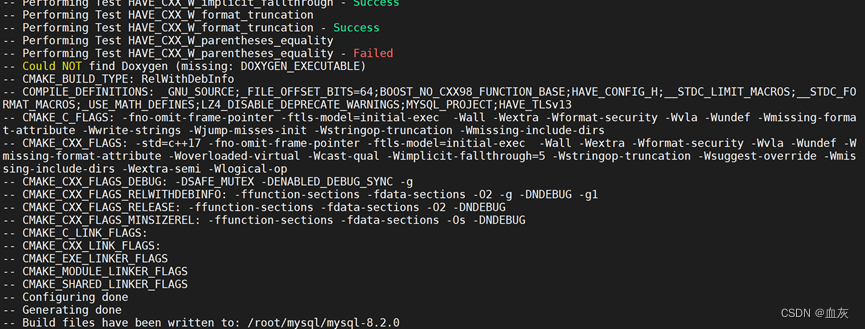
预编译完成:
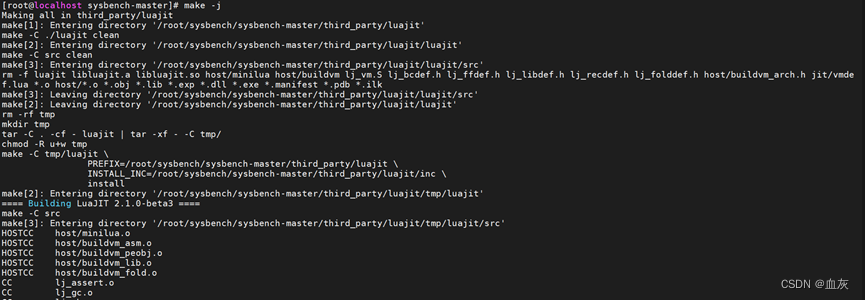
执行mak命令
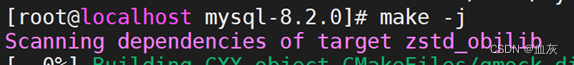 这里使用的是make -j 如果不加j参数是单线程,加入j参数就是调用所有cpu进行编译速度会快很多,如果不想使用全部CPU可以在j后加数字例如 make -j 4 这样就是使用4颗CPU进行编译

Make完成:

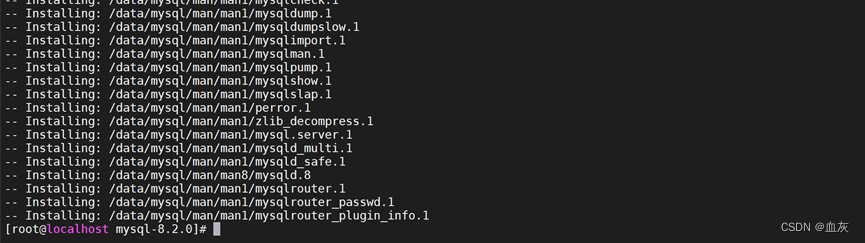
执行make install 安装
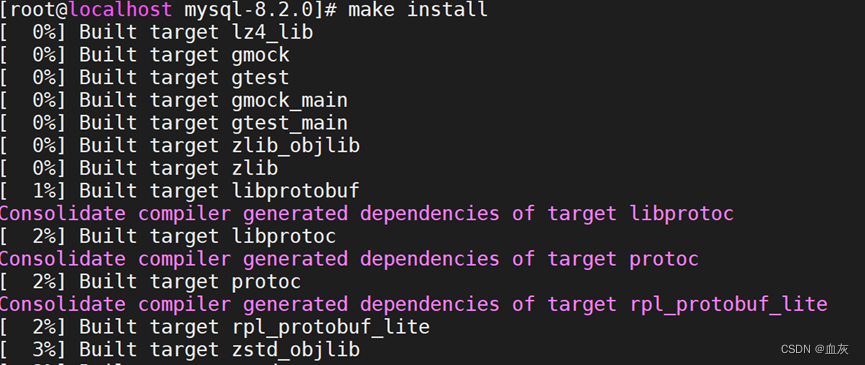 安装完成:
安装完成:
配置mysql服务和开机自动启动:
cp /data/mysql/support-files/mysql.server /etc/rc.d/init.d/mysql
systemctl daemon-reload
systemctl status mysql
systemctl enable mysql

修改my.cnf,对mysql进行配置:
[client]
[mysqld]
port = 3306
socket = /tmp/mysql.sock
log_error = /var/log/mysql-error.log
datadir = /data/data
user = mysql
max_connections = 8000
lower_case_table_names = 1
innodb_buffer_pool_size = 208G
innodb_page_size = 8192
innodb_buffer_pool_instances = 6
innodb_file_per_table = OFF
sort_buffer_size = 1M
#innodb_flush_method = O_DIRECT
innodb_io_capacity = 4000000
innodb_page_cleaners = 4
#innodb_fast_shutdown = 0
innodb_flush_neighbors = 0
#innodb_log_group_home_dir = /data/iblogs
innodb_log_files_in_group = 3
innodb_log_file_size = 1024M
innodb_log_buffer_size = 100M
innodb_flush_log_at_trx_commit = 0
innodb_write_io_threads = 48
innodb_read_io_threads = 48
innodb_thread_concurrency = 0
tmpdir = /tmp
max_prepared_stmt_count = 99999
sync_binlog = 1000
[mysqldump]
参数说明:
log_error = /var/log/mysql-error.log #mysql错误日志,启动不了可以看这个地方
datadir = /data/data #mysql数据存放位置
max_connections = 8000 #最大TCP链接输
innodb_buffer_pool_size = 208G #关键参数innodb缓存大小设置成内存的60-80%
innodb_page_size = 8192 #缓存页大小
innodb_buffer_pool_instances = 6 #缓存实例 设置成4-8
#innodb_flush_method = O_DIRECT #设置成O_DIRECT时数据落盘不经过操作系统内存
innodb_io_capacity = 4000000 #存储的IOPS
innodb_page_cleaners = 4 #内存脏页刷新线程数
innodb_flush_neighbors = 0 #内存脏页刷新时带不带隔壁,对于传统机械硬盘建议使用1开启,而对于固态硬盘可以使用0关闭
#innodb_log_group_home_dir = /data/iblogs
innodb_log_files_in_group = 3 #比较关键参数事务日志个数
innodb_log_file_size = 1024M #比较关键参数事务日志大小,本配置中当事务日志达到3个1G时会触发回收
innodb_log_buffer_size = 100M
innodb_flush_log_at_trx_commit = 0 #关键参数值为0 : 提交事务的时候,不立即把 redo log buffer 里的数据刷入磁盘文件的,而是依靠 InnoDB 的主线程每秒执行一次刷新到磁盘。此时可能你提交事务了,结果 mysql 宕机了,然后此时内存里的数据全部丢失。值为1 : 提交事务的时候,就必须把 redo log 从内存刷入到磁盘文件里去,只要事务提交成功,那么 redo log 就必然在磁盘里了。注意,因为操作系统的“延迟写”特性,此时的刷入只是写到了操作系统的缓冲区中,因此执行同步操作才能保证一定持久化到了硬盘中。值为2 : 提交事务的时候,把 redo 日志写入磁盘文件对应的 os cache 缓存里去,而不是直接进入磁盘文件,可能 1 秒后才会把 os cache 里的数据写入到磁盘文件里去。只有1才能真正地保证事务的持久性,但是由于刷新操作 fsync() 是阻塞的,直到完成后才返回,我们知道写磁盘的速度是很慢的,因此 MySQL 的性能会明显地下降。如果不在乎事务丢失,0和2能获得更高的性能。
#sync_binlog = 1000 #比较关键参数sync_binlog=0 的时候,表示每次提交事务都只 write,不 fsync;sync_binlog=1 的时候,表示每次提交事务都会执行 fsync;sync_binlog=N(N>1) 的时候,表示每次提交事务都 write,但累积 N 个事务后才 fsync。因此,在出现 IO 瓶颈的场景里,将 sync_binlog 设置成一个比较大的值,可以提升性能。在实际的业务场景中,考虑到丢失日志量的可控性,一般不建议将这个参数设成 0,比较常见的是将其设置为 100~1000 中的某个数值。但是,将 sync_binlog 设置为 N,对应的风险是:如果主机发生异常重启,会丢失最近 N 个事务的 binlog 日志。
innodb_write_io_threads = 48 #比较关键参数数据库写时可以调用的线程建议设置成CPU核数的一半
innodb_read_io_threads = 48 #比较关键参数数据库读时可以调用的线程建议设置成CPU核数的一半
innodb_thread_concurrency = 0 #比较关键参数数据库可以使用的CPU核数,0是不限制
tmpdir = /tmp
#skip_ssl
max_prepared_stmt_count = 99999 #数据库最大允许多少链接
执行mysql初始化:
/data/mysql/bin/mysqld --initialize --basedir=/data/mysql --datadir=/data/data/ --lower-case-table-names=1 --user=mysql

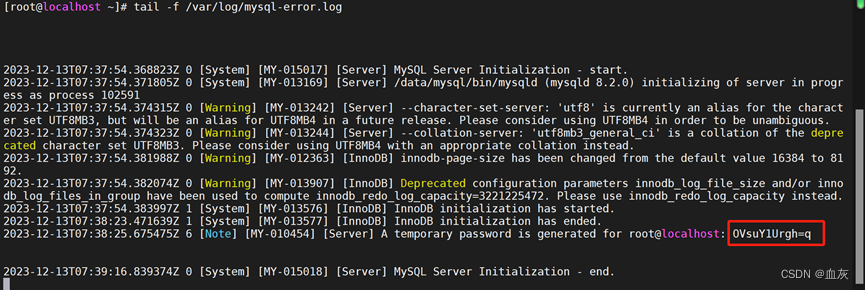
查看root用户的密码:
tail -f /var/log/mysql-error.log
启动mysql:
systemctl start mysql

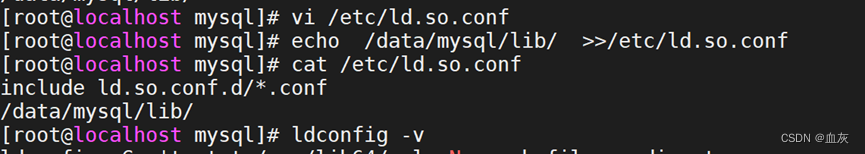
添加mysql链接库到系统
echo /data/mysql/lib/ >>/etc/ld.so.conf
ldconfig -v
修改PATH,可以使用mysql命令:
echo 'export PATH=$PATH:/data/mysql/bin/' >> /etc/profile

mysql初始化:
mysql_secure_installation
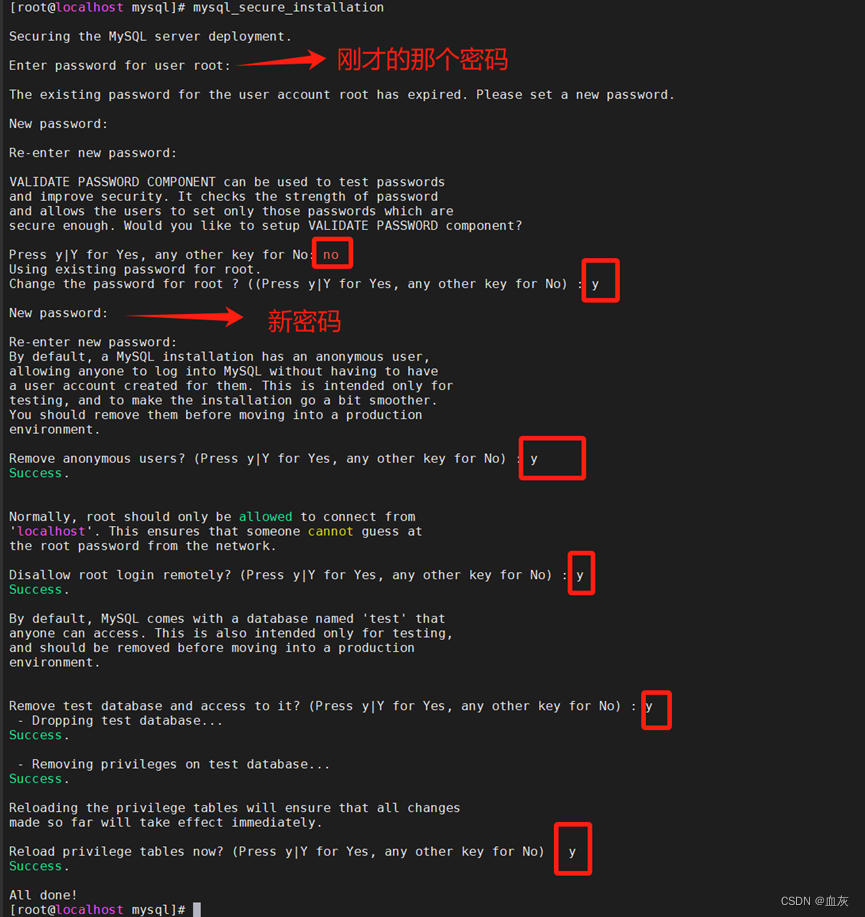
Mysql 至此安装配置完毕。
Sysbench
Sysbench下载地址:
GitHub - akopytov/sysbench: Scriptable database and system performance benchmarkScriptable database and system performance benchmark - GitHub - akopytov/sysbench: Scriptable database and system performance benchmarkhttps://github.com/akopytov/sysbench/
安装automake和相关软件:
yum install automake libtool libsysfs
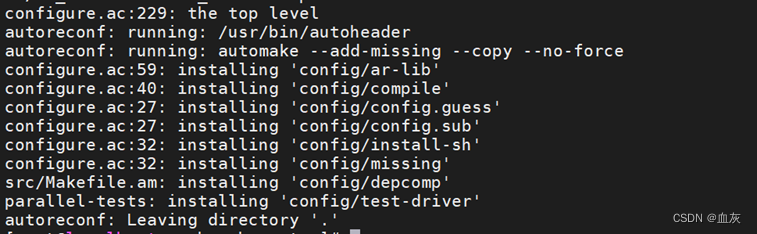
进入sysbench解压路径执行automake脚本:
./autogen.sh

Automake完成:
执行configure配置编译:
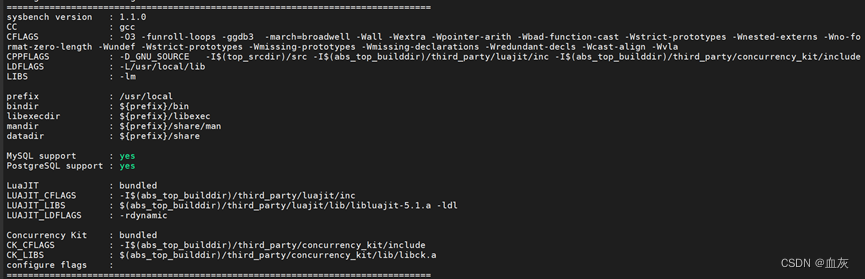
./configure --with-pgsql --with-mysql-includes=/data/mysql/include/ --with-mysql-libs=/data/mysql/lib/
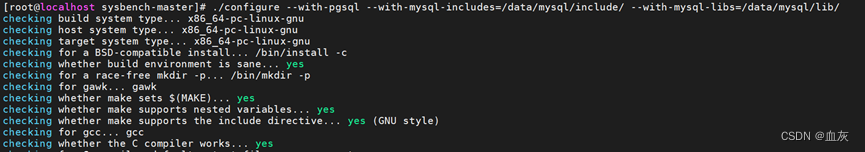
配置完成:
执行make:
make -j
 Make完成:
执行make install安装:
 安装完成:
安装完成:

- Sysbench测试*
*Sysbench对File IO进行测试: *
具体测试的步骤和方法我不介绍了,可以查看:
File IO测试主要分为两种,一种是模拟正常的Linux文件读写操作,另一种是使用O_Direct模式下直接把读写请求下发到存储,区别就是读写数据的时候经不经过系统缓存,关键参数有如下几个,原理见图:
--file-extra-flags=direct
--file-fsync-end=off
--file-fsync-freq=0
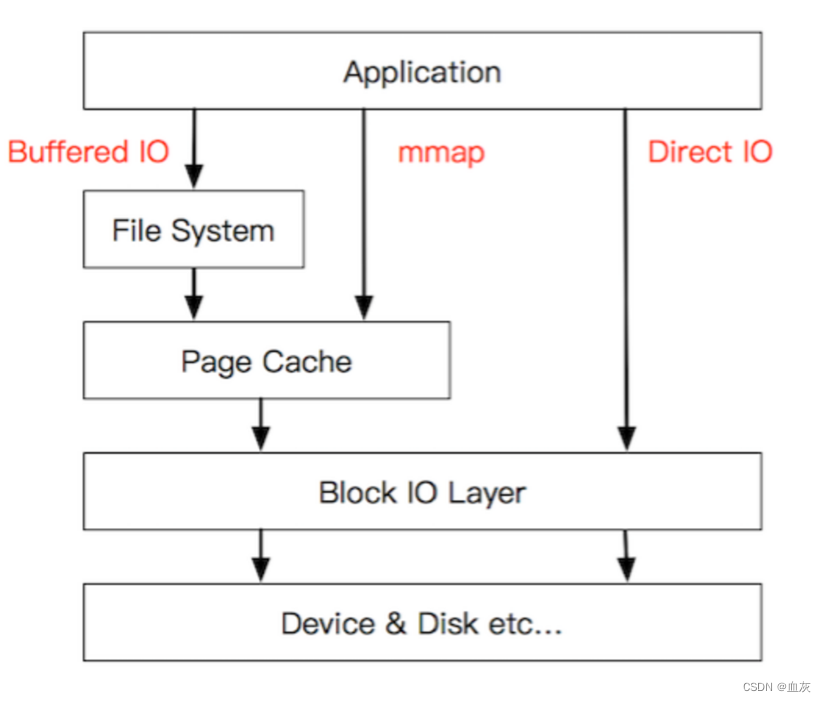 理论上来说O_Direct模式下可以测试出当前环境下存储的真实的性能,IOPS和带宽。
本次测试以8K块大小随机读写性能为基准对存储进行压力测试。
测试环境Intel+Vmware+Huawei Oceanstor 5510V5环境测试结果:
sysbench fileio --file-num=20 --file-total-size=20G --threads=16 prepare
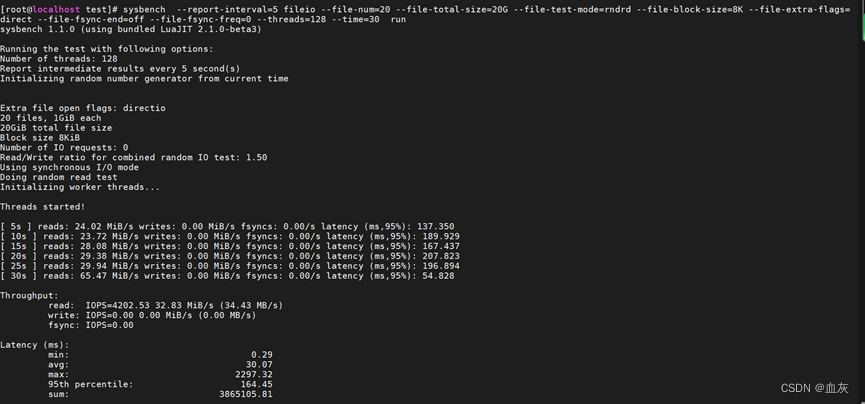
sysbench --report-interval=5 fileio --file-num=20 --file-total-size=20G --file-test-mode=rndrd --file-block-size=8K --file-extra-flags=direct --file-fsync-end=off --file-fsync-freq=0 --threads=128 --time=30 run
sysbench 1.1.0 (using bundled LuaJIT 2.1.0-beta3)
Running the test with following options:
Number of threads: 128
Report intermediate results every 5 second(s)
Initializing random number generator from current time
Extra file open flags: directio
20 files, 1GiB each
20GiB total file size
Block size 8KiB
Number of IO requests: 0
Read/Write ratio for combined random IO test: 1.50
Using synchronous I/O mode
Doing random read test
Initializing worker threads...
Threads started!
[ 5s ] reads: 24.02 MiB/s writes: 0.00 MiB/s fsyncs: 0.00/s latency (ms,95%): 137.350
[ 10s ] reads: 23.72 MiB/s writes: 0.00 MiB/s fsyncs: 0.00/s latency (ms,95%): 189.929
[ 15s ] reads: 28.08 MiB/s writes: 0.00 MiB/s fsyncs: 0.00/s latency (ms,95%): 167.437
[ 20s ] reads: 29.38 MiB/s writes: 0.00 MiB/s fsyncs: 0.00/s latency (ms,95%): 207.823
[ 25s ] reads: 29.94 MiB/s writes: 0.00 MiB/s fsyncs: 0.00/s latency (ms,95%): 196.894
[ 30s ] reads: 65.47 MiB/s writes: 0.00 MiB/s fsyncs: 0.00/s latency (ms,95%): 54.828
Throughput:
     read:  IOPS=4202.53 32.83 MiB/s (34.43 MB/s)

     write: IOPS=0.00 0.00 MiB/s (0.00 MB/s)

     fsync: IOPS=0.00
Latency (ms):
     min:                                  0.29

     avg:                                 30.07

     max:                               2297.32

     95th percentile:                    164.45

     sum:                            3865105.81

sysbench --report-interval=5 fileio --file-num=20 --file-total-size=20G --file-test-mode=rndwr --file-block-size=8K --file-extra-flags=direct --file-fsync-end=off --file-fsync-freq=0 --threads=128 run
sysbench 1.1.0 (using bundled LuaJIT 2.1.0-beta3)
Running the test with following options:
Number of threads: 128
Report intermediate results every 5 second(s)
Initializing random number generator from current time
Extra file open flags: directio
20 files, 1GiB each
20GiB total file size
Block size 8KiB
Number of IO requests: 0
Read/Write ratio for combined random IO test: 1.50
Using synchronous I/O mode
Doing random write test
Initializing worker threads...
Threads started!
[ 5s ] reads: 0.00 MiB/s writes: 125.69 MiB/s fsyncs: 0.00/s latency (ms,95%): 9.560
Throughput:
     read:  IOPS=0.00 0.00 MiB/s (0.00 MB/s)

     write: IOPS=16242.83 126.90 MiB/s (133.06 MB/s)

     fsync: IOPS=0.00
Latency (ms):
     min:                                  3.09

     avg:                                  7.88

     max:                                444.62

     95th percentile:                      9.56

     sum:                            1279924.48
 结果分析:
结果分析:
读的流量和IOPS数据为34.43 MB/s和4202.53
写的流量和IOPS数据为133.06 MB/s 和16242.83
原因是测试环境中使用的存储是Huawei Oceanstor5510V5混闪存储,配置的是SSD+NL-sas硬盘,开启了数据分层,由于我的测试环境读写流量不是连续触发不了存储的数据分层(存储监控15分钟内热点数据放到SSD层),也就是这次测试的读写数据基本都落在了NL_SAS层,随机读由于随机所以缓存命中率低,数据是真正从NL_SAS层一个一个找出来的,所以IOPS相对较小,随机写的时候数据首先会进入到存储的缓存然后再进行异步的落盘操作,所以随机写的IOPS会高。如果我连续测试一段时间触发了存储的数据分层功能我认为IOPS数据会比当前测试出的数据高很多,尤其是随机读。
另外,在进行Sysbench时线程数也比较重要,判断系统读写压力是否已经是最大的最简单的办法就是通过nmon工具查看CPU情况,当出现下图这种情况基本就属于压力较大,当CPU还有空闲的情况时就需要考虑是否要增加线程

客户ARM+Huawei Dorado5600V6环境测试结果:
随机direct模式读:(8K块大小,1个文件20G) IOPS(187934)
sysbench --report-interval=5 fileio --file-num=1 --file-total-size=20G --file-test-mode=rndrd --file-block-size=8K --file-extra-flags=direct --file-fsync-end=off --file-fsync-freq=0 --threads=128 run
sysbench 1.1.0 (using bundled LuaJIT 2.1.0-beta3)
Running the test with following options:
Number of threads: 128
Report intermediate results every 5 second(s)
Initializing random number generator from current time
Extra file open flags: directio
1 files, 20GiB each
20GiB total file size
Block size 8KiB
Number of IO requests: 0
Read/Write ratio for combined random IO test: 1.50
Using synchronous I/O mode
Doing random read test
Initializing worker threads...
Threads started!
[ 5s ] reads: 1468.34 MiB/s writes: 0.00 MiB/s fsyncs: 0.00/s latency (ms,95%): 1.142
[ 10s ] reads: 1468.20 MiB/s writes: 0.00 MiB/s fsyncs: 0.00/s latency (ms,95%): 1.163
Throughput:
     read:  IOPS=187934.67 1468.24 MiB/s (1539.56 MB/s)

     write: IOPS=0.00 0.00 MiB/s (0.00 MB/s)

     fsync: IOPS=0.00
Latency (ms):
     min:                                  0.26

     avg:                                  0.68

     max:                                  9.40

     95th percentile:                      1.16

     sum:                            1278010.57
随机direct模式写:(8K块大小,1个文件20G) IOPS(187934)
sysbench --report-interval=5 fileio --file-num=1 --file-total-size=20G --file-test-mode=rndwr --file-block-size=8K --file-extra-flags=direct --file-fsync-end=off --file-fsync-freq=0 --threads=128 run
sysbench 1.1.0 (using bundled LuaJIT 2.1.0-beta3)
Running the test with following options:
Number of threads: 128
Report intermediate results every 5 second(s)
Initializing random number generator from current time
Extra file open flags: directio
1 files, 20GiB each
20GiB total file size
Block size 8KiB
Number of IO requests: 0
Read/Write ratio for combined random IO test: 1.50
Using synchronous I/O mode
Doing random write test
Initializing worker threads...
Threads started!
[ 5s ] reads: 0.00 MiB/s writes: 1182.27 MiB/s fsyncs: 0.00/s latency (ms,95%): 1.205
[ 10s ] reads: 0.00 MiB/s writes: 1186.01 MiB/s fsyncs: 0.00/s latency (ms,95%): 1.163
Throughput:
     read:  IOPS=0.00 0.00 MiB/s (0.00 MB/s)

     write: IOPS=151560.62 1184.07 MiB/s (1241.58 MB/s)

     fsync: IOPS=0.00
Latency (ms):
     min:                                  0.20

     avg:                                  0.84

     max:                                 14.72

     95th percentile:                      1.18

     sum:                            1278377.38
结果分析:
读的流量和IOPS分别为1539.56 MB/s(这个数接近两个8GBHBA卡的理论值速度说明这个测试结果这里可能有瓶颈随机读的IOPS应该比后边的18万7还要高,我在2K和4K的时候测出过20万上下的IOPS)和187934.67。
写的流量和IOPS分别为1241.58 MB/s和151560.62也就是随机写的IOPS在15万上下。
**PS: **20万和15万随机读写的IOPS并不是这个存储的极限值,听同事说他们测试出的结果比这个20万和15万要大很多(40万上下),可能是因为我的终端少的原因LUN少的原因,真正要测试到存储性能极限应该是多客户的单文件系统多LUN场景。
Sysbench对Mysql压力测试:
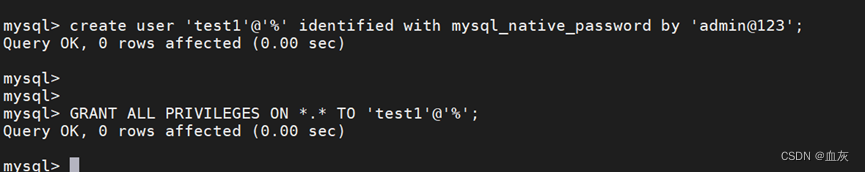
创建test1用户:
create user 'test1'@'%' identified with mysql_native_password by 'admin@123';
GRANT ALL PRIVILEGES ON . TO 'test1'@'%';
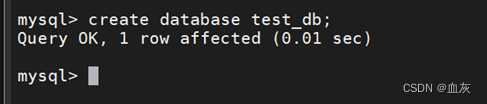
Mysql新建测试库:
create database test_db;
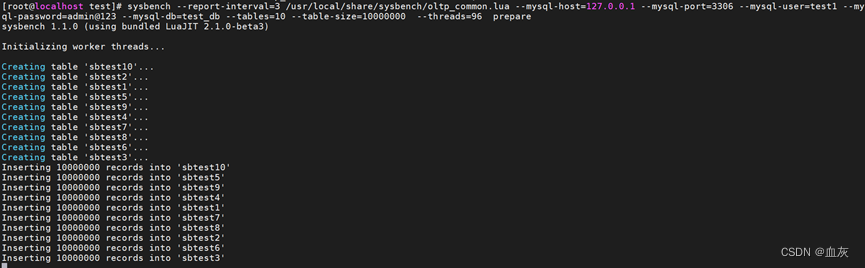
Sysbench数据库测试10张1000万的表,主要测试oltp_read_write.lua
新建10张1000万的表:
sysbench --report-interval=3 /usr/local/share/sysbench/oltp_common.lua --mysql-host=127.0.0.1 --mysql-port=3306 --mysql-user=test1 --mysql-password=admin@123 --mysql-db=test_db --tables=10 --table-size=10000000 --threads=96 prepare
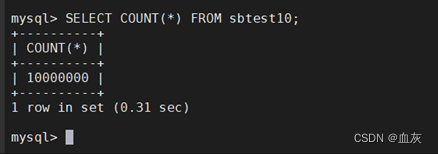
SELECT COUNT(*) FROM sbtest10;
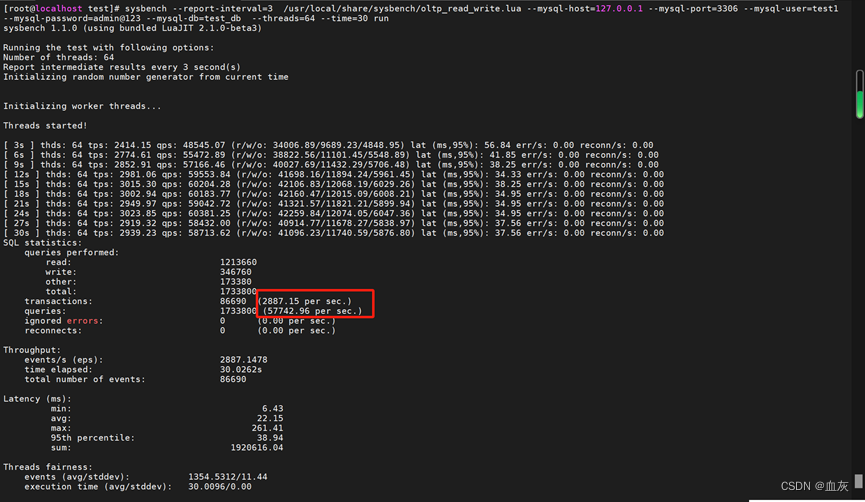
64线程OLTP_rad_wirte测试 tps约2800 qps约5.8****万
sysbench --report-interval=3 /usr/local/share/sysbench/oltp_read_write.lua --mysql-host=127.0.0.1 --mysql-port=3306 --mysql-user=test1 --mysql-password=admin@123 --mysql-db=test_db --threads=64 --time=30 run
sysbench 1.1.0 (using bundled LuaJIT 2.1.0-beta3)
Running the test with following options:
Number of threads: 64
Report intermediate results every 3 second(s)
Initializing random number generator from current time
Initializing worker threads...
Threads started!
[ 3s ] thds: 64 tps: 2414.15 qps: 48545.07 (r/w/o: 34006.89/9689.23/4848.95) lat (ms,95%): 56.84 err/s: 0.00 reconn/s: 0.00
[ 6s ] thds: 64 tps: 2774.61 qps: 55472.89 (r/w/o: 38822.56/11101.45/5548.89) lat (ms,95%): 41.85 err/s: 0.00 reconn/s: 0.00
[ 9s ] thds: 64 tps: 2852.91 qps: 57166.46 (r/w/o: 40027.69/11432.29/5706.48) lat (ms,95%): 38.25 err/s: 0.00 reconn/s: 0.00
[ 12s ] thds: 64 tps: 2981.06 qps: 59553.84 (r/w/o: 41698.16/11894.24/5961.45) lat (ms,95%): 34.33 err/s: 0.00 reconn/s: 0.00
[ 15s ] thds: 64 tps: 3015.30 qps: 60204.28 (r/w/o: 42106.83/12068.19/6029.26) lat (ms,95%): 38.25 err/s: 0.00 reconn/s: 0.00
[ 18s ] thds: 64 tps: 3002.94 qps: 60183.77 (r/w/o: 42160.47/12015.09/6008.21) lat (ms,95%): 34.95 err/s: 0.00 reconn/s: 0.00
[ 21s ] thds: 64 tps: 2949.97 qps: 59042.72 (r/w/o: 41321.57/11821.21/5899.94) lat (ms,95%): 34.95 err/s: 0.00 reconn/s: 0.00
[ 24s ] thds: 64 tps: 3023.85 qps: 60381.25 (r/w/o: 42259.84/12074.05/6047.36) lat (ms,95%): 34.95 err/s: 0.00 reconn/s: 0.00
[ 27s ] thds: 64 tps: 2919.32 qps: 58432.00 (r/w/o: 40914.77/11678.27/5838.97) lat (ms,95%): 37.56 err/s: 0.00 reconn/s: 0.00
[ 30s ] thds: 64 tps: 2939.23 qps: 58713.62 (r/w/o: 41096.23/11740.59/5876.80) lat (ms,95%): 37.56 err/s: 0.00 reconn/s: 0.00
SQL statistics:
queries performed:

    read:                            1213660

    write:                           346760

    other:                           173380

    total:                           1733800

transactions:                        86690  (2887.15 per sec.)

queries:                             1733800 (57742.96 per sec.)

ignored errors:                      0      (0.00 per sec.)

reconnects:                          0      (0.00 per sec.)
Throughput:
events/s (eps):                      2887.1478

time elapsed:                        30.0262s

total number of events:              86690
Latency (ms):
     min:                                    6.43

     avg:                                   22.15

     max:                                  261.41

     95th percentile:                       38.94

     sum:                              1920616.04
Threads fairness:
events (avg/stddev):           1354.5312/11.44

execution time (avg/stddev):   30.0096/0.00
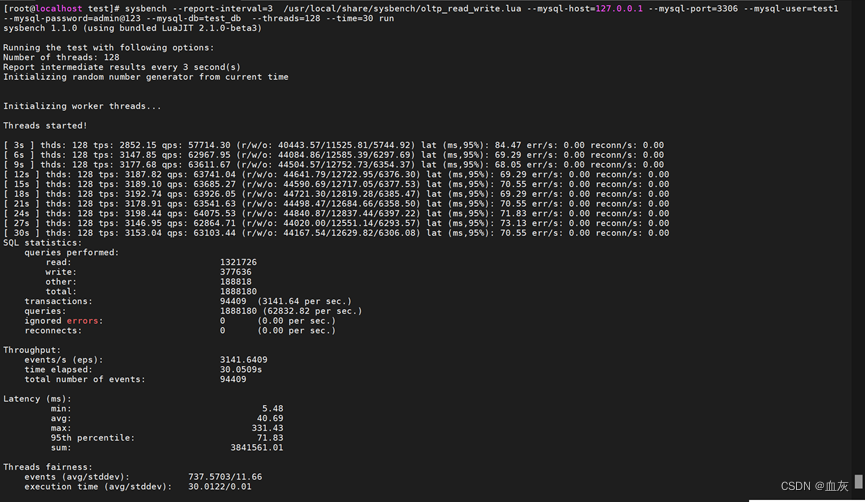
128线程OLTP_rad_wirte测试 tps约3000 qps约6.2****万
sysbench --report-interval=3 /usr/local/share/sysbench/oltp_read_write.lua --mysql-host=127.0.0.1 --mysql-port=3306 --mysql-user=test1 --mysql-password=admin@123 --mysql-db=test_db --threads=128 --time=30 run
sysbench 1.1.0 (using bundled LuaJIT 2.1.0-beta3)
Running the test with following options:
Number of threads: 128
Report intermediate results every 3 second(s)
Initializing random number generator from current time
Initializing worker threads...
Threads started!
[ 3s ] thds: 128 tps: 2852.15 qps: 57714.30 (r/w/o: 40443.57/11525.81/5744.92) lat (ms,95%): 84.47 err/s: 0.00 reconn/s: 0.00
[ 6s ] thds: 128 tps: 3147.85 qps: 62967.95 (r/w/o: 44084.86/12585.39/6297.69) lat (ms,95%): 69.29 err/s: 0.00 reconn/s: 0.00
[ 9s ] thds: 128 tps: 3177.68 qps: 63611.67 (r/w/o: 44504.57/12752.73/6354.37) lat (ms,95%): 68.05 err/s: 0.00 reconn/s: 0.00
[ 12s ] thds: 128 tps: 3187.82 qps: 63741.04 (r/w/o: 44641.79/12722.95/6376.30) lat (ms,95%): 69.29 err/s: 0.00 reconn/s: 0.00
[ 15s ] thds: 128 tps: 3189.10 qps: 63685.27 (r/w/o: 44590.69/12717.05/6377.53) lat (ms,95%): 70.55 err/s: 0.00 reconn/s: 0.00
[ 18s ] thds: 128 tps: 3192.74 qps: 63926.05 (r/w/o: 44721.30/12819.28/6385.47) lat (ms,95%): 69.29 err/s: 0.00 reconn/s: 0.00
[ 21s ] thds: 128 tps: 3178.91 qps: 63541.63 (r/w/o: 44498.47/12684.66/6358.50) lat (ms,95%): 70.55 err/s: 0.00 reconn/s: 0.00
[ 24s ] thds: 128 tps: 3198.44 qps: 64075.53 (r/w/o: 44840.87/12837.44/6397.22) lat (ms,95%): 71.83 err/s: 0.00 reconn/s: 0.00
[ 27s ] thds: 128 tps: 3146.95 qps: 62864.71 (r/w/o: 44020.00/12551.14/6293.57) lat (ms,95%): 73.13 err/s: 0.00 reconn/s: 0.00
[ 30s ] thds: 128 tps: 3153.04 qps: 63103.44 (r/w/o: 44167.54/12629.82/6306.08) lat (ms,95%): 70.55 err/s: 0.00 reconn/s: 0.00
SQL statistics:
queries performed:

    read:                            1321726

    write:                           377636

    other:                           188818

    total:                           1888180

transactions:                        94409  (3141.64 per sec.)

queries:                             1888180 (62832.82 per sec.)

ignored errors:                      0      (0.00 per sec.)

reconnects:                          0      (0.00 per sec.)
Throughput:
events/s (eps):                      3141.6409

time elapsed:                        30.0509s

total number of events:              94409
Latency (ms):
     min:                                    5.48

     avg:                                   40.69

     max:                                  331.43

     95th percentile:                       71.83

     sum:                              3841561.01
Threads fairness:
events (avg/stddev):           737.5703/11.66

execution time (avg/stddev):   30.0122/0.01
256线程OLTP_rad_wirte测试 tps约3100 qps约6.3****万
sysbench --report-interval=3 /usr/local/share/sysbench/oltp_read_write.lua --mysql-host=127.0.0.1 --mysql-port=3306 --mysql-user=test1 --mysql-password=admin@123 --mysql-db=test_db --threads=256 --time=30 run
sysbench 1.1.0 (using bundled LuaJIT 2.1.0-beta3)
Running the test with following options:
Number of threads: 256
Report intermediate results every 3 second(s)
Initializing random number generator from current time
Initializing worker threads...
Threads started!
[ 3s ] thds: 256 tps: 2899.31 qps: 59378.73 (r/w/o: 41720.15/11775.72/5882.86) lat (ms,95%): 164.45 err/s: 0.00 reconn/s: 0.00
[ 6s ] thds: 256 tps: 3119.46 qps: 62484.27 (r/w/o: 43660.81/12584.53/6238.93) lat (ms,95%): 153.02 err/s: 0.00 reconn/s: 0.00
[ 9s ] thds: 256 tps: 3131.55 qps: 62724.31 (r/w/o: 43898.35/12562.20/6263.76) lat (ms,95%): 155.80 err/s: 0.00 reconn/s: 0.00
[ 12s ] thds: 256 tps: 3137.38 qps: 62512.35 (r/w/o: 43781.05/12459.54/6271.77) lat (ms,95%): 155.80 err/s: 0.00 reconn/s: 0.00
[ 15s ] thds: 256 tps: 3122.63 qps: 62485.62 (r/w/o: 43729.83/12509.19/6246.60) lat (ms,95%): 158.63 err/s: 0.00 reconn/s: 0.00
[ 18s ] thds: 256 tps: 3178.39 qps: 63726.76 (r/w/o: 44592.76/12775.22/6358.78) lat (ms,95%): 155.80 err/s: 0.00 reconn/s: 0.00
[ 21s ] thds: 256 tps: 3212.72 qps: 64082.44 (r/w/o: 44904.11/12754.55/6423.78) lat (ms,95%): 147.61 err/s: 0.00 reconn/s: 0.00
[ 24s ] thds: 256 tps: 3230.99 qps: 64863.03 (r/w/o: 45356.12/13043.27/6463.64) lat (ms,95%): 144.97 err/s: 0.00 reconn/s: 0.00
[ 27s ] thds: 256 tps: 3250.30 qps: 64906.97 (r/w/o: 45482.18/12924.19/6500.60) lat (ms,95%): 153.02 err/s: 0.00 reconn/s: 0.00
[ 30s ] thds: 256 tps: 3210.30 qps: 64200.43 (r/w/o: 44905.61/12875.22/6419.61) lat (ms,95%): 150.29 err/s: 0.00 reconn/s: 0.00
SQL statistics:
queries performed:

    read:                            1326374

    write:                           378964

    other:                           189482

    total:                           1894820

transactions:                        94741  (3148.91 per sec.)

queries:                             1894820 (62978.13 per sec.)

ignored errors:                      0      (0.00 per sec.)

reconnects:                          0      (0.00 per sec.)
Throughput:
events/s (eps):                      3148.9064

time elapsed:                        30.0870s

total number of events:              94741
Latency (ms):
     min:                                    6.56

     avg:                                   81.10

     max:                                  416.75

     95th percentile:                      153.02

     sum:                              7683421.86
Threads fairness:
events (avg/stddev):           370.0820/9.19

execution time (avg/stddev):   30.0134/0.01

系统压力情况:

客户ARM+Huawei Dorado5600V6环境测试结果:
128线程OLTP_rad_wirte测试 tps约1.5万 qps约30万
sysbench --report-interval=3 /usr/local/share/sysbench/oltp_read_write.lua --mysql-host=127.0.0.1 --mysql-port=3306 --mysql-user=test1 --mysql-password=admin@123 --mysql-db=test_db --threads=128 --time=30 run
sysbench 1.1.0 (using bundled LuaJIT 2.1.0-beta3)
Running the test with following options:
Number of threads: 128
Report intermediate results every 3 second(s)
Initializing random number generator from current time
Initializing worker threads...
Threads started!
[ 3s ] thds: 128 tps: 15166.66 qps: 304070.71 (r/w/o: 212913.86/60780.89/30375.95) lat (ms,95%): 13.46 err/s: 0.00 reconn/s: 0.00
[ 6s ] thds: 128 tps: 15603.67 qps: 311997.68 (r/w/o: 218398.34/62392.00/31207.33) lat (ms,95%): 11.45 err/s: 0.00 reconn/s: 0.00
[ 9s ] thds: 128 tps: 15337.83 qps: 306682.99 (r/w/o: 214663.33/61344.66/30675.00) lat (ms,95%): 11.45 err/s: 0.00 reconn/s: 0.00
[ 12s ] thds: 128 tps: 15525.01 qps: 310399.61 (r/w/o: 217271.86/62078.39/31049.36) lat (ms,95%): 11.45 err/s: 0.00 reconn/s: 0.00
[ 15s ] thds: 128 tps: 15302.99 qps: 305873.13 (r/w/o: 214109.52/61159.29/30604.31) lat (ms,95%): 12.08 err/s: 0.00 reconn/s: 0.00
[ 18s ] thds: 128 tps: 15213.24 qps: 304544.81 (r/w/o: 213194.03/60921.29/30429.48) lat (ms,95%): 12.30 err/s: 0.00 reconn/s: 0.00
[ 21s ] thds: 128 tps: 15258.80 qps: 305196.07 (r/w/o: 213659.59/61020.88/30515.61) lat (ms,95%): 12.08 err/s: 0.00 reconn/s: 0.00
[ 24s ] thds: 128 tps: 15058.19 qps: 301285.54 (r/w/o: 210859.38/60308.11/30118.05) lat (ms,95%): 12.30 err/s: 0.00 reconn/s: 0.00
[ 27s ] thds: 128 tps: 14756.63 qps: 295047.20 (r/w/o: 206570.44/58963.51/29513.25) lat (ms,95%): 13.22 err/s: 0.00 reconn/s: 0.00
[ 30s ] thds: 128 tps: 15142.77 qps: 302853.82 (r/w/o: 212006.84/60561.10/30285.88) lat (ms,95%): 12.30 err/s: 0.00 reconn/s: 0.00
SQL statistics:
queries performed:

    read:                            6401584

    write:                           1829024

    other:                           914512

    total:                           9145120

transactions:                        457256 (15225.84 per sec.)

queries:                             9145120 (304516.81 per sec.)

ignored errors:                      0      (0.00 per sec.)

reconnects:                          0      (0.00 per sec.)
Throughput:
events/s (eps):                      15225.8405

time elapsed:                        30.0316s

total number of events:              457256
Latency (ms):
     min:                                    3.52

     avg:                                    8.40

     max:                                   74.67

     95th percentile:                       12.08

     sum:                              3838723.94
Threads fairness:
events (avg/stddev):           3572.3125/28.17

execution time (avg/stddev):   29.9900/0.00
256线程OLTP_rad_wirte测试 tps约1.6万 qps约33万
sysbench --report-interval=3 /usr/local/share/sysbench/oltp_read_write.lua --mysql-host=127.0.0.1 --mysql -port=3306 --mysql-user=test1 --mysql-password=admin@123 --mysql-db=test_db --threads=256 --time=30 run
sysbench 1.1.0 (using bundled LuaJIT 2.1.0-beta3)
Running the test with following options:
Number of threads: 256
Report intermediate results every 3 second(s)
Initializing random number generator from current time
Initializing worker threads...
Threads started!
[ 3s ] thds: 256 tps: 11849.98 qps: 238251.40 (r/w/o: 166883.92/47586.28/23781.20) lat (ms,95%): 78.60 err/s: 0.00 reconn/s: 0.00
[ 6s ] thds: 256 tps: 16479.07 qps: 329688.11 (r/w/o: 230777.68/65949.29/32961.14) lat (ms,95%): 24.83 err/s: 0.00 reconn/s: 0.00
[ 9s ] thds: 256 tps: 16407.63 qps: 328197.56 (r/w/o: 229743.79/65637.84/32815.92) lat (ms,95%): 23.95 err/s: 0.33 reconn/s: 0.00
[ 12s ] thds: 256 tps: 16534.86 qps: 330813.88 (r/w/o: 231555.71/66188.11/33070.05) lat (ms,95%): 23.52 err/s: 0.00 reconn/s: 0.0 0
[ 15s ] thds: 256 tps: 16298.66 qps: 325849.48 (r/w/o: 228110.54/65141.97/32596.98) lat (ms,95%): 25.28 err/s: 0.00 reconn/s: 0.0 0
[ 18s ] thds: 256 tps: 16594.61 qps: 331902.50 (r/w/o: 232315.18/66398.10/33189.22) lat (ms,95%): 23.95 err/s: 0.00 reconn/s: 0.00
[ 21s ] thds: 256 tps: 16883.17 qps: 337453.62 (r/w/o: 236238.97/67449.32/33765.33) lat (ms,95%): 23.10 err/s: 0.00 reconn/s: 0.00
[ 24s ] thds: 256 tps: 16509.38 qps: 330344.93 (r/w/o: 231198.31/66127.52/33019.09) lat (ms,95%): 23.95 err/s: 0.00 reconn/s: 0.00
[ 27s ] thds: 256 tps: 16554.83 qps: 331111.18 (r/w/o: 231812.23/66188.64/33110.32) lat (ms,95%): 23.95 err/s: 0.00 reconn/s: 0.00
[ 30s ] thds: 256 tps: 16695.55 qps: 332540.55 (r/w/o: 232671.28/66563.18/33306.09) lat (ms,95%): 23.52 err/s: 0.00 reconn/s: 0.00
SQL statistics:
queries performed:

    read:                            6756316

    write:                           1930373

    other:                           965187

    total:                           9651876

transactions:                        482593 (16058.05 per sec.)

queries:                             9651876 (321161.44 per sec.)

ignored errors:                      1      (0.03 per sec.)

reconnects:                          0      (0.00 per sec.)
Throughput:
events/s (eps):                      16058.0454

time elapsed:                        30.0530s

total number of events:              482593
Latency (ms):
     min:                                    3.06

     avg:                                   15.91

     max:                                  475.14

     95th percentile:                       24.83

     sum:                              7677627.58
Threads fairness:
events (avg/stddev):           1885.1289/26.20

execution time (avg/stddev):   29.9907/0.01
版权归原作者 血灰 所有, 如有侵权,请联系我们删除。