
前言:Echarts,它是一个与框架无关的 JS 图表库,但是它基于Js,这样很多框架都能使用它,例如Vue,估计IONIC也能用,下次研究。
因为我的习惯,每次新尝试做一个功能的时候,总要新创建个小项目,做做Demo。
首先看自己电脑是否安装了Vue,打开终端命令:vue --version,我以前安装过Vue,但是不知道为何报错:
vue/cli Error: Cannot find module ‘@vue/cli-shared-utils‘
注意:如果是全局module出错,就全局更新,如果是项目中module出错,就删除(rimraf node_modules)重新安装 (npm i)
解决方法(更新或者重装):
npm update -g @vue/cli
# 或者
yarn global upgrade --latest @vue/cli
在自己特定的项目文件夹下cmd打开终端
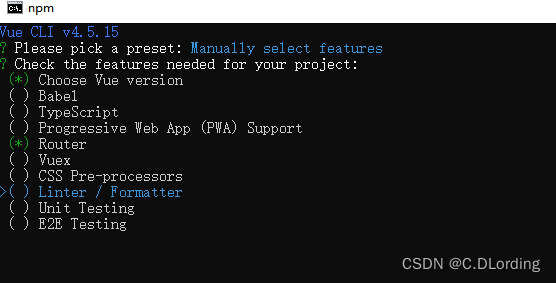
- vue create echarts
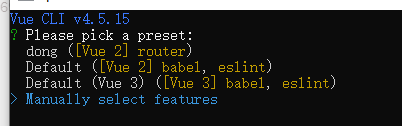
- 默认习惯创建,选择package.json之后输入 n 或者 y ,过程简略。
 cd echarts 到该文件夹下,npm run serve显示项目运行正常:
正式开始尝试Echarts
建议大家要学会看官网文档:https://echarts.apache.org/handbook/zh/get-started/
能学习到两点:
- 在绘图前我们需要为 ECharts 准备一个定义了高宽的 DOM 容器。
- 通过 echarts.init 方法初始化一个 echarts 实例并通过 setOption 方法生成一个简单的柱状图。
基于这两句话进行研究:我通常是在About中尝试进行写Demo。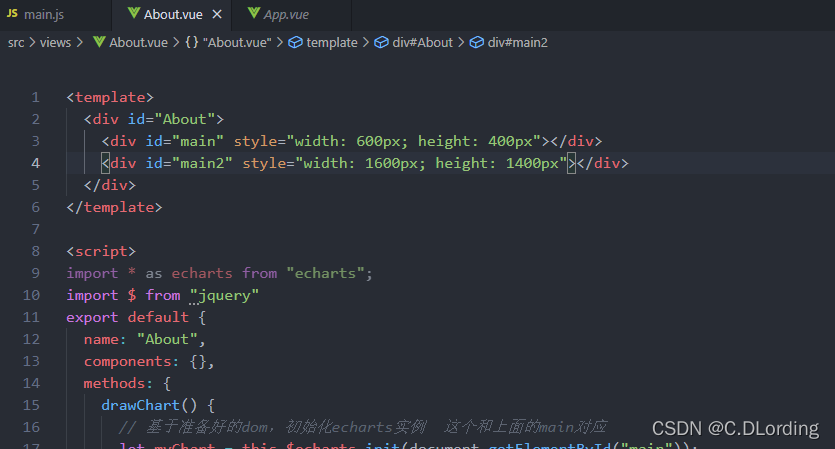
Ctrl + C结束项目。
在项目终端安装echarts:npm install echarts --save
请注意,2022年后安装的echarts都是5.X版本,可以在package.json中看到,不知为何,这个和Vue项目不匹配,导致发生错误,知道原因的麻烦在下面留言。
全局引入:在 main.js 中全局引入 echarts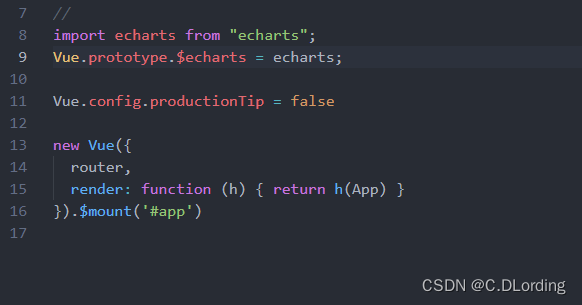
import echarts from"echarts";
Vue.prototype.$echarts = echarts;
在About.Vue中的
<template> </template>写<div id="main" style="width: 600px; height: 400px"></div>
,如上图,对应1. 在绘图前我们需要为 ECharts 准备一个定义了高宽的 DOM 容器。
<divid="main"style="width: 600px;height: 400px"></div>
对应 2.通过 echarts.init 方法初始化一个 echarts 实例并通过 setOption 方法生成一个简单的柱状图。这个需要在script中进行操作。
示例一:
drawChart(){// 基于准备好的dom,初始化echarts实例  这个和上面的main对应let myChart =this.$echarts.init(document.getElementById("main"));// 指定图表的配置项和数据let option ={
        title:{
          text:"ECharts 入门示例",},
        tooltip:{},
        legend:{
          data:["销量"],},
        xAxis:{
          data:["衬衫","羊毛衫","雪纺衫","裤子","高跟鞋","袜子"],},
        yAxis:{},
        series:[{
            name:"销量",
            type:"bar",
            data:[5,20,36,10,10,20],},],};// 使用刚指定的配置项和数据显示图表。
      myChart.setOption(option);},
然后新建monted(){},否则会出现init没有定义等等错误。
mounted(){this.drawChart();},
到这一步,其实示例一已经完成,但是我们运行发现图片无法显示,只有一处警告错误:"export ‘default’ (imported as ‘echarts’) was not found in ‘echarts’
起着怀疑的态度进行百度,https://blog.csdn.net/Aom_yt/article/details/110947734 ,给出的原因是“可能还不能支持最新版的echarts5.0” 这句话不一定对,麻烦知道原因的在下面进行评论。
解决方法:
- 卸载: npm uninstall echarts
- 重装echarts: npm install echarts@4.9.0
- 重新运行项目,发现成功了。
 示例二: 我的需求和目标是将https://echarts.apache.org/examples/zh/editor.html?c=bar-race-country&version=5.2.1导入到我的Vue项目中,基于上面1和2原理,上代码:
<divid="main2"style="width: 1600px;height: 1400px"></div>
drawChart2(){// 基于准备好的dom,初始化echarts实例  这个和上面的main2对应let myChart =this.$echarts.init(document.getElementById("main2"));// 指定图表的配置项和数据varROOT_PATH="https://cdn.jsdelivr.net/gh/apache/echarts-website@asf-site/examples";// var chartDom = document.getElementById("main");// var myChart = echarts.init(chartDom);var option;const updateFrequency =2000;const dimension =0;const countryColors ={
        Australia:"#00008b",
        Canada:"#f00",
        China:"#ffde00",
        Cuba:"#002a8f",
        Finland:"#003580",
        France:"#ed2939",
        Germany:"#000",
        Iceland:"#003897",
        India:"#f93",
        Japan:"#bc002d","North Korea":"#024fa2","South Korea":"#000","New Zealand":"#00247d",
        Norway:"#ef2b2d",
        Poland:"#dc143c",
        Russia:"#d52b1e",
        Turkey:"#e30a17","United Kingdom":"#00247d","United States":"#b22234",};
      $.when(
        $.getJSON("https://cdn.jsdelivr.net/npm/[email protected]/data.json"),
        $.getJSON(ROOT_PATH+"/data/asset/data/life-expectancy-table.json")).done(function(res0, res1){const flags = res0[0];const data = res1[0];const years =[];for(let i =0; i < data.length;++i){if(years.length ===0|| years[years.length -1]!== data[i][4]){
            years.push(data[i][4]);}}functiongetFlag(countryName){if(!countryName){return"";}return(
            flags.find(function(item){return item.name === countryName;})||{}).emoji;}let startIndex =10;let startYear = years[startIndex];
        option ={
          grid:{
            top:10,
            bottom:30,
            left:150,
            right:80,},
          xAxis:{
            max:"dataMax",
            axisLabel:{formatter:function(n){return Math.round(n)+"";},},},
          dataset:{
            source: data.slice(1).filter(function(d){return d[4]=== startYear;}),},
          yAxis:{type:"category",
            inverse:true,
            max:10,
            axisLabel:{
              show:true,
              fontSize:14,formatter:function(value){return value +"{flag|"+getFlag(value)+"}";},
              rich:{
                flag:{
                  fontSize:25,
                  padding:5,},},},
            animationDuration:300,
            animationDurationUpdate:300,},
          series:[{
              realtimeSort:true,
              seriesLayoutBy:"column",type:"bar",
              itemStyle:{color:function(param){return countryColors[param.value[3]]||"#5470c6";},},
              encode:{
                x: dimension,
                y:3,},
              label:{
                show:true,
                precision:1,
                position:"right",
                valueAnimation:true,
                fontFamily:"monospace",},},],// Disable init animation.
          animationDuration:0,
          animationDurationUpdate: updateFrequency,
          animationEasing:"linear",
          animationEasingUpdate:"linear",
          graphic:{
            elements:[{type:"text",
                right:160,
                bottom:60,
                style:{
                  text: startYear,
                  font:"bolder 80px monospace",
                  fill:"rgba(100, 100, 100, 0.25)",},
                z:100,},],},};// console.log(option);
        myChart.setOption(option);for(let i = startIndex; i < years.length -1;++i){(function(i){setTimeout(function(){updateYear(years[i +1]);},(i - startIndex)* updateFrequency);})(i);}functionupdateYear(year){let source = data.slice(1).filter(function(d){return d[4]=== year;});
          option.series[0].data = source;
          option.graphic.elements[0].style.text = year;
          myChart.setOption(option);}});// 使用刚指定的配置项和数据显示图表。
      myChart.setOption(option);},
mounted(){this.drawChart2();},
不一一解释了,只要你弄懂了示例一,这个也能运行出来,同时也能举一反三。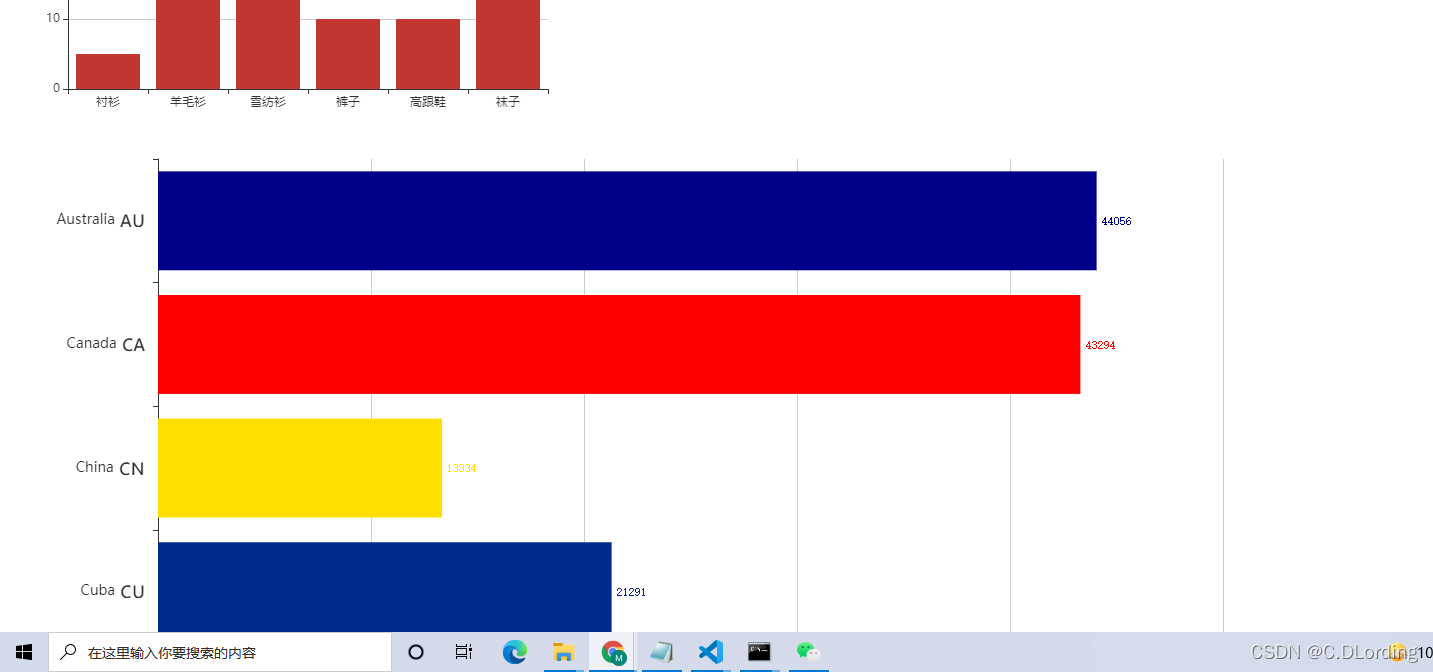
其他:
在学习Echarts时候,发现这个用途很广,很多的人都在使用,也延伸出来了很多包,比如
- 封装的D3,简化了代码。https://github.com/Finedl/Vue-echart-D3 示例:

版权归原作者 C.DLording 所有, 如有侵权,请联系我们删除。