
文章目录
1、简介
https://dash.plotly.com/
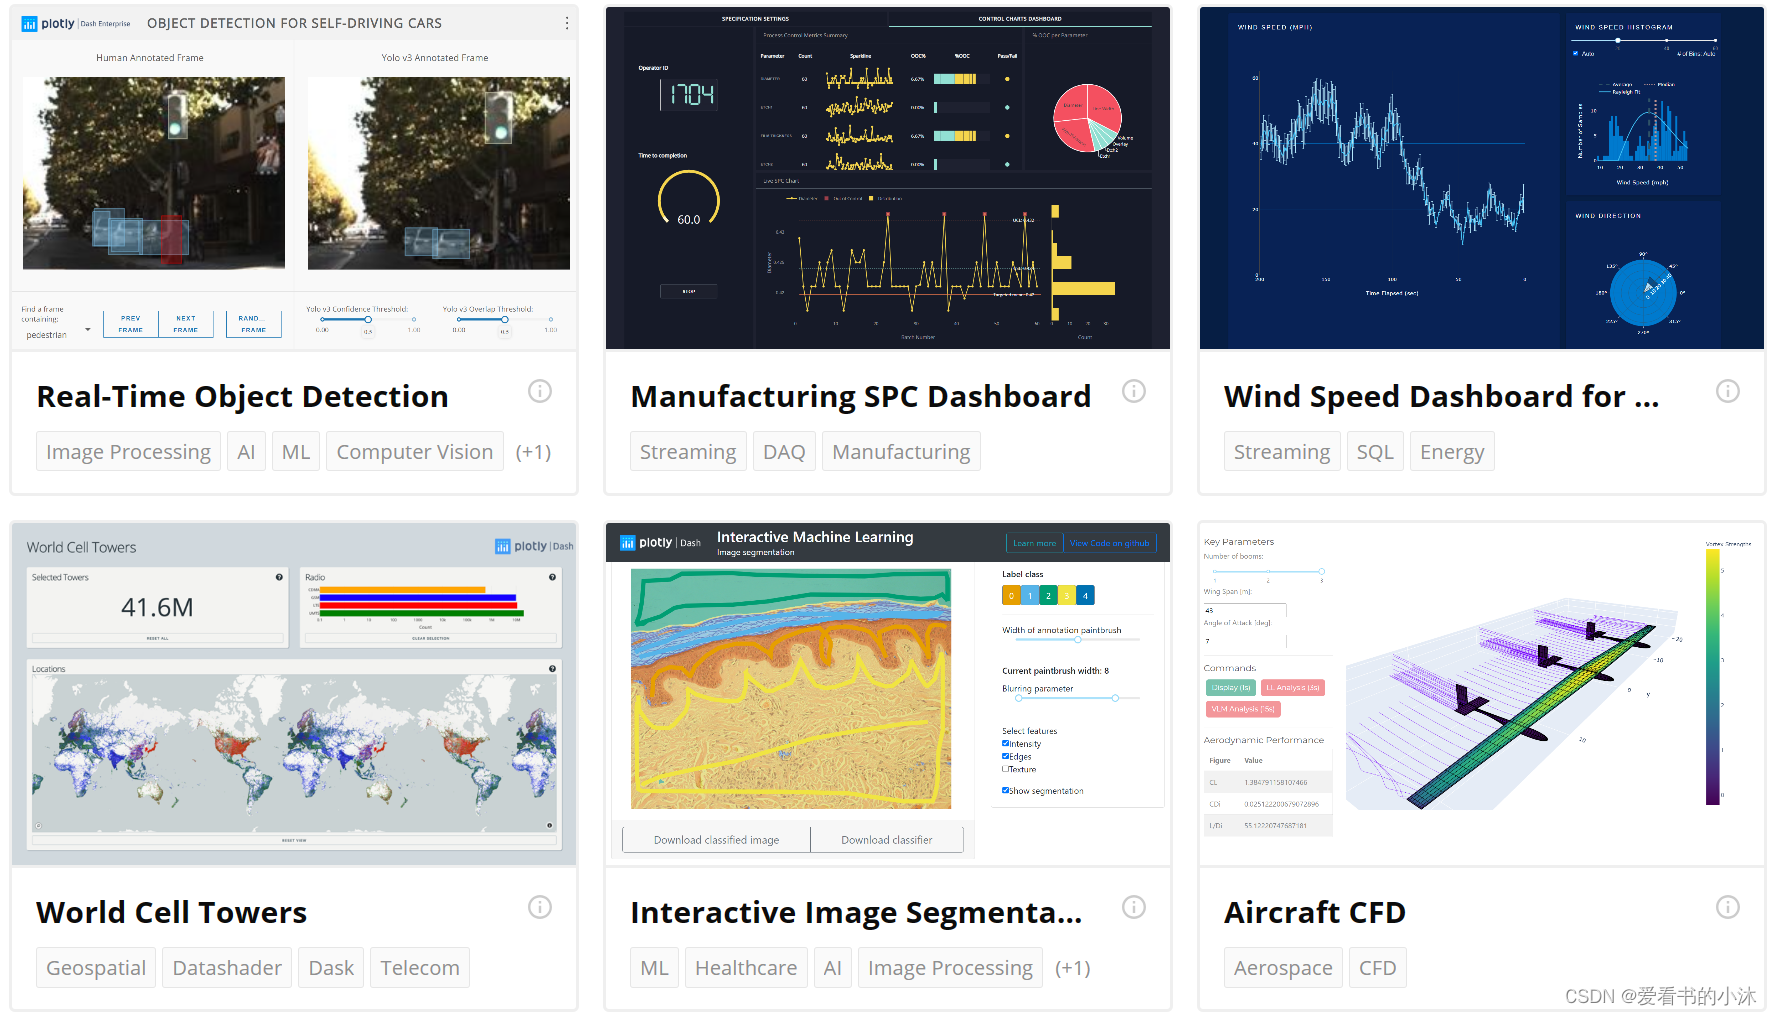
https://dash.gallery/Portal/
Dash 是一个用于构建Web应用程序的 Python 库,无需 JavaScript 。
Dash是下载量最大,最值得信赖的Python框架,用于构建ML和数据科学Web应用程序。
Dash是一个用来创建 web 应用的 python 库,它建立在 Plotly.js(同一个团队开发)、React 和 Flask 之上,主要的用户群体是数据分析者、AI 从业者,可以帮助他们快速搭建非常美观的网页应用,而且不需要你懂 javascript。
Dash 建立在 Plotly.js、React 和 Flask 之上,将现代 UI 元素(如下拉列表、滑块和图形)与你的分析 Python 代码相结合。
Dash使用pip即可安装。用它可以启动一个http server, python调用它做图,而它内部将这些图置换成JavaScript显示,进行数据分析和展示。
2、安装
pip install pandas
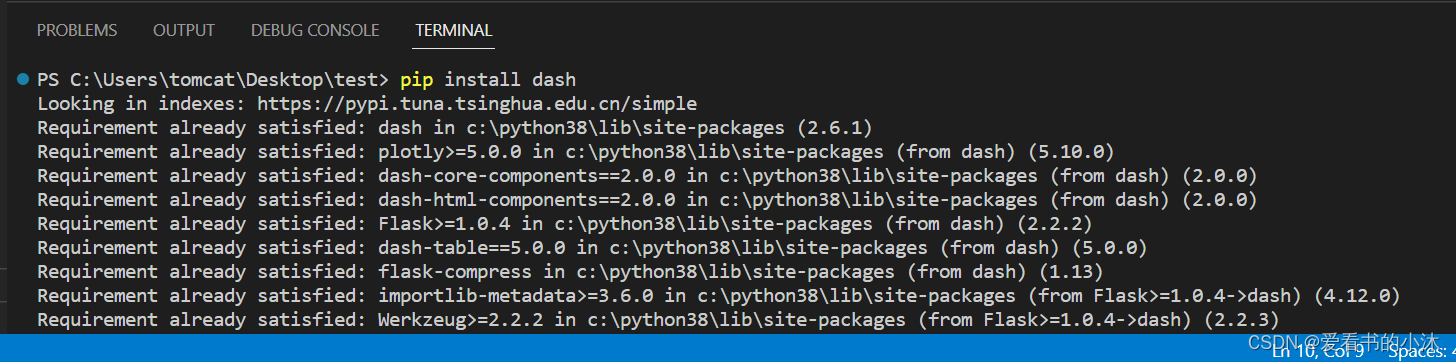
pip install dash
# pip install dash --user -i https://pypi.tuna.tsinghua.edu.cn/simple
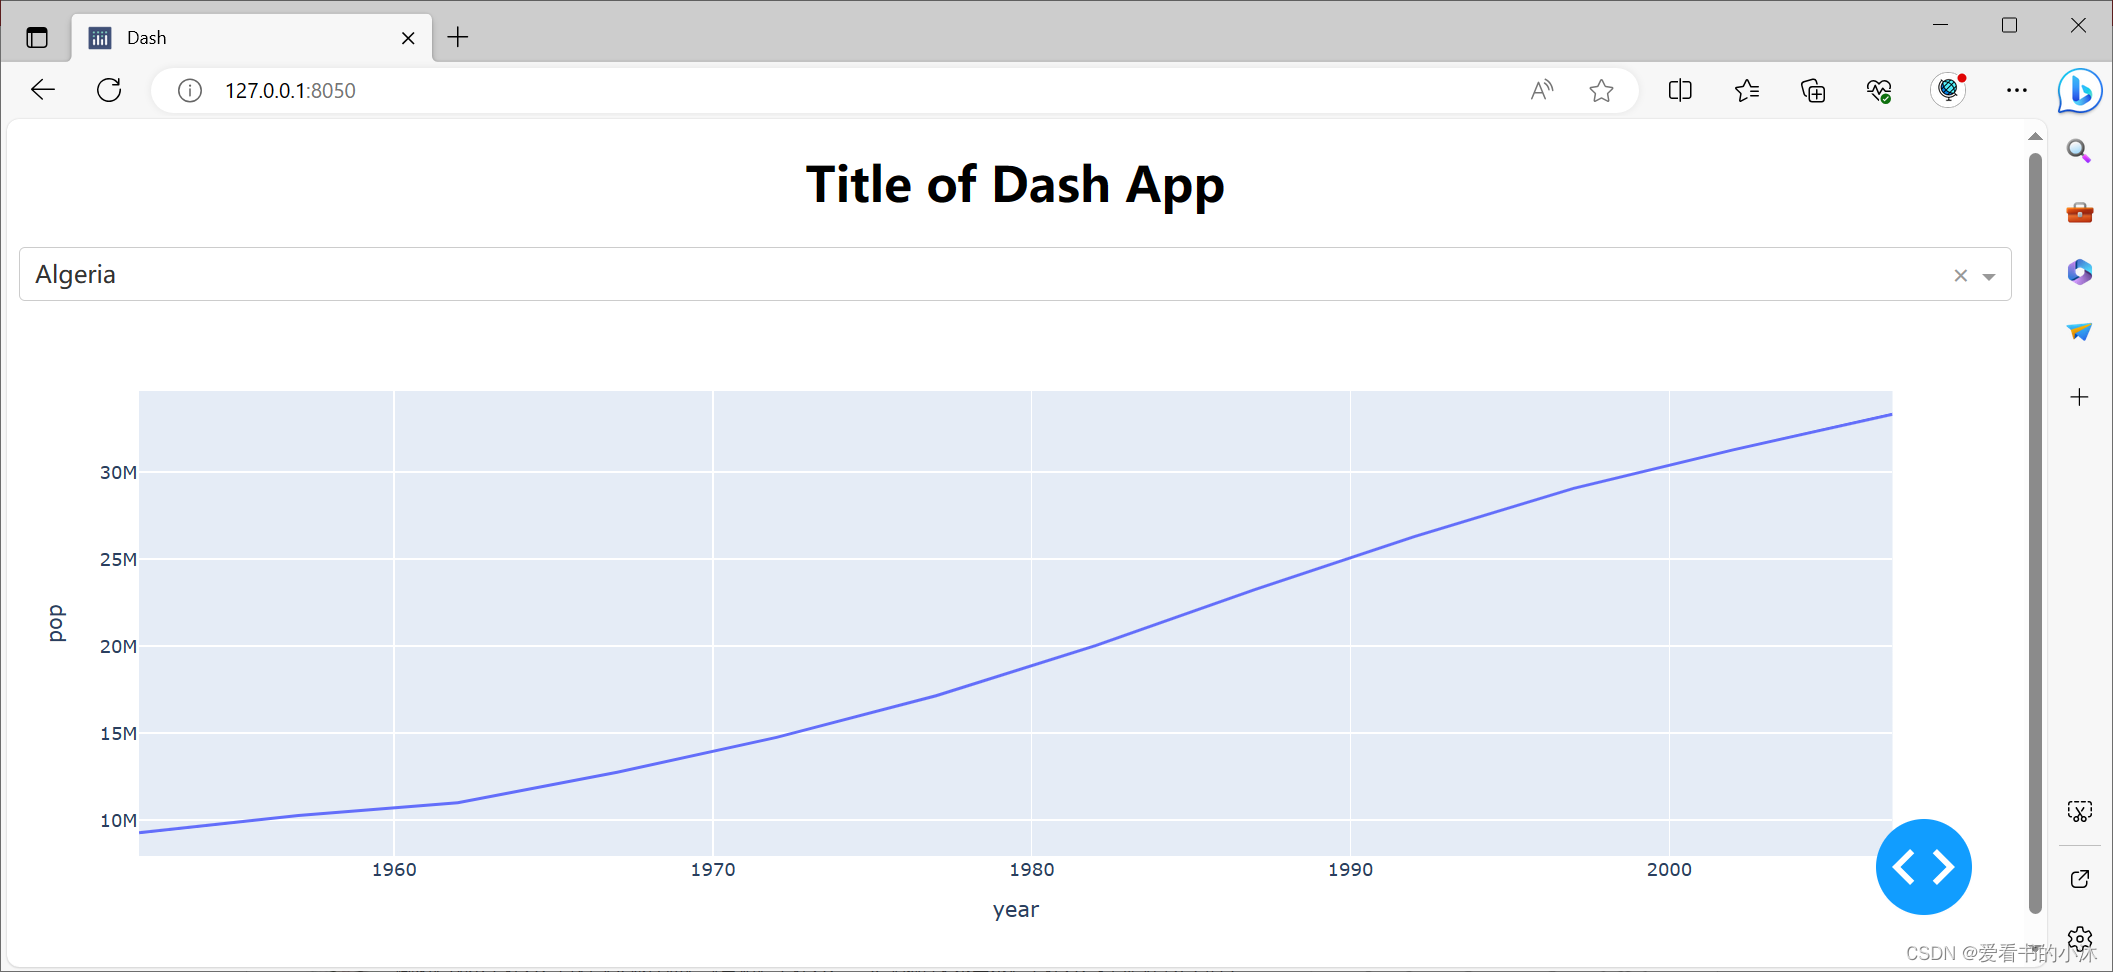
- 最小 Dash 应用 一个最小的Dash 应用程序通常如下所示:
from dash import Dash, html, dcc, callback, Output, Input
import plotly.express as px
import pandas as pd

df = pd.read_csv('https://raw.githubusercontent.com/plotly/datasets/master/gapminder_unfiltered.csv')

app = Dash(__name__)

app.layout = html.Div([
    html.H1(children='Title of Dash App', style={'textAlign':'center'}),
    dcc.Dropdown(df.country.unique(),'Canada',id='dropdown-selection'),
    dcc.Graph(id='graph-content')])@callback(
    Output('graph-content','figure'),
    Input('dropdown-selection','value'))defupdate_graph(value):
    dff = df[df.country==value]return px.line(dff, x='year', y='pop')if __name__ =='__main__':
    app.run(debug=True)
3、功能示例
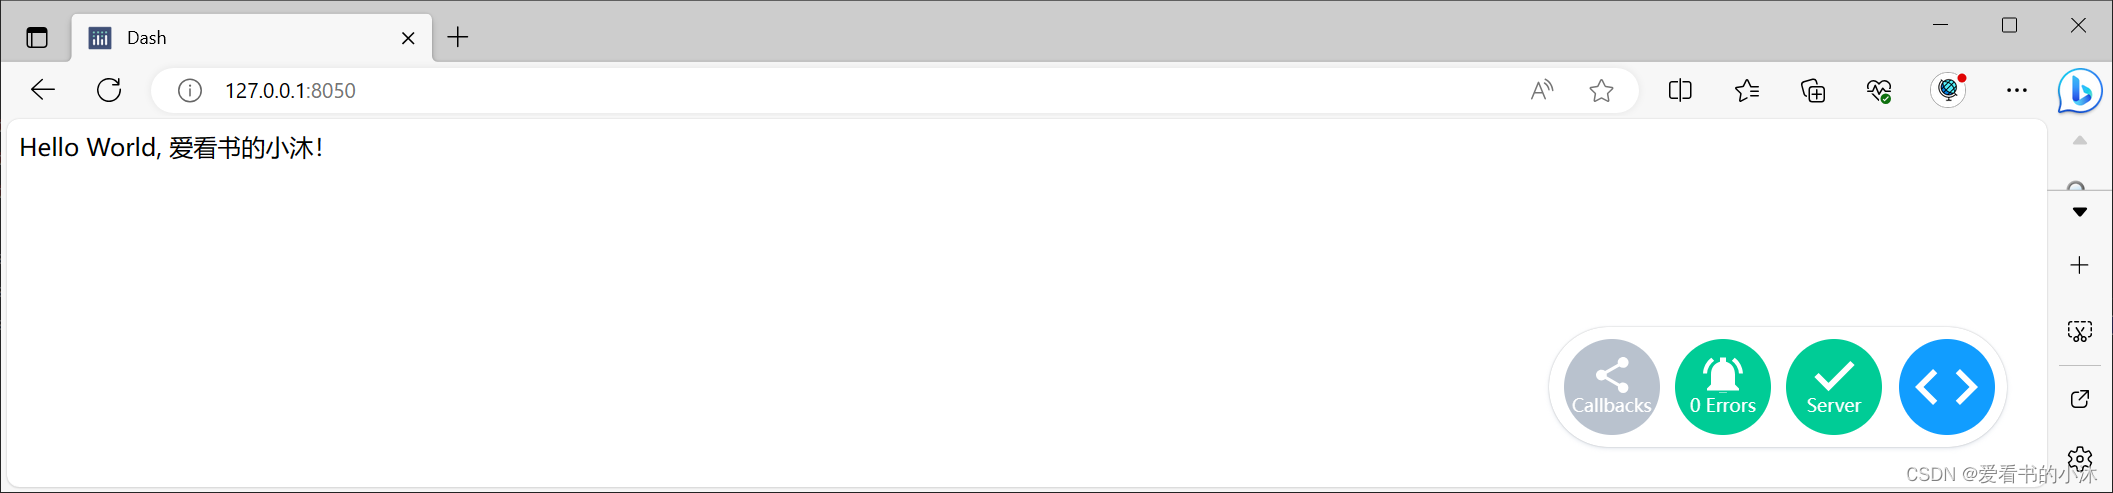
3.1 Hello World
下面的代码创建了一个非常小的“Hello World”Dash应用程序。
from dash import Dash, html

app = Dash(__name__)

app.layout = html.Div([
    html.Div(children='Hello World, 爱看书的小沐!')])if __name__ =='__main__':
    app.run(debug=True)
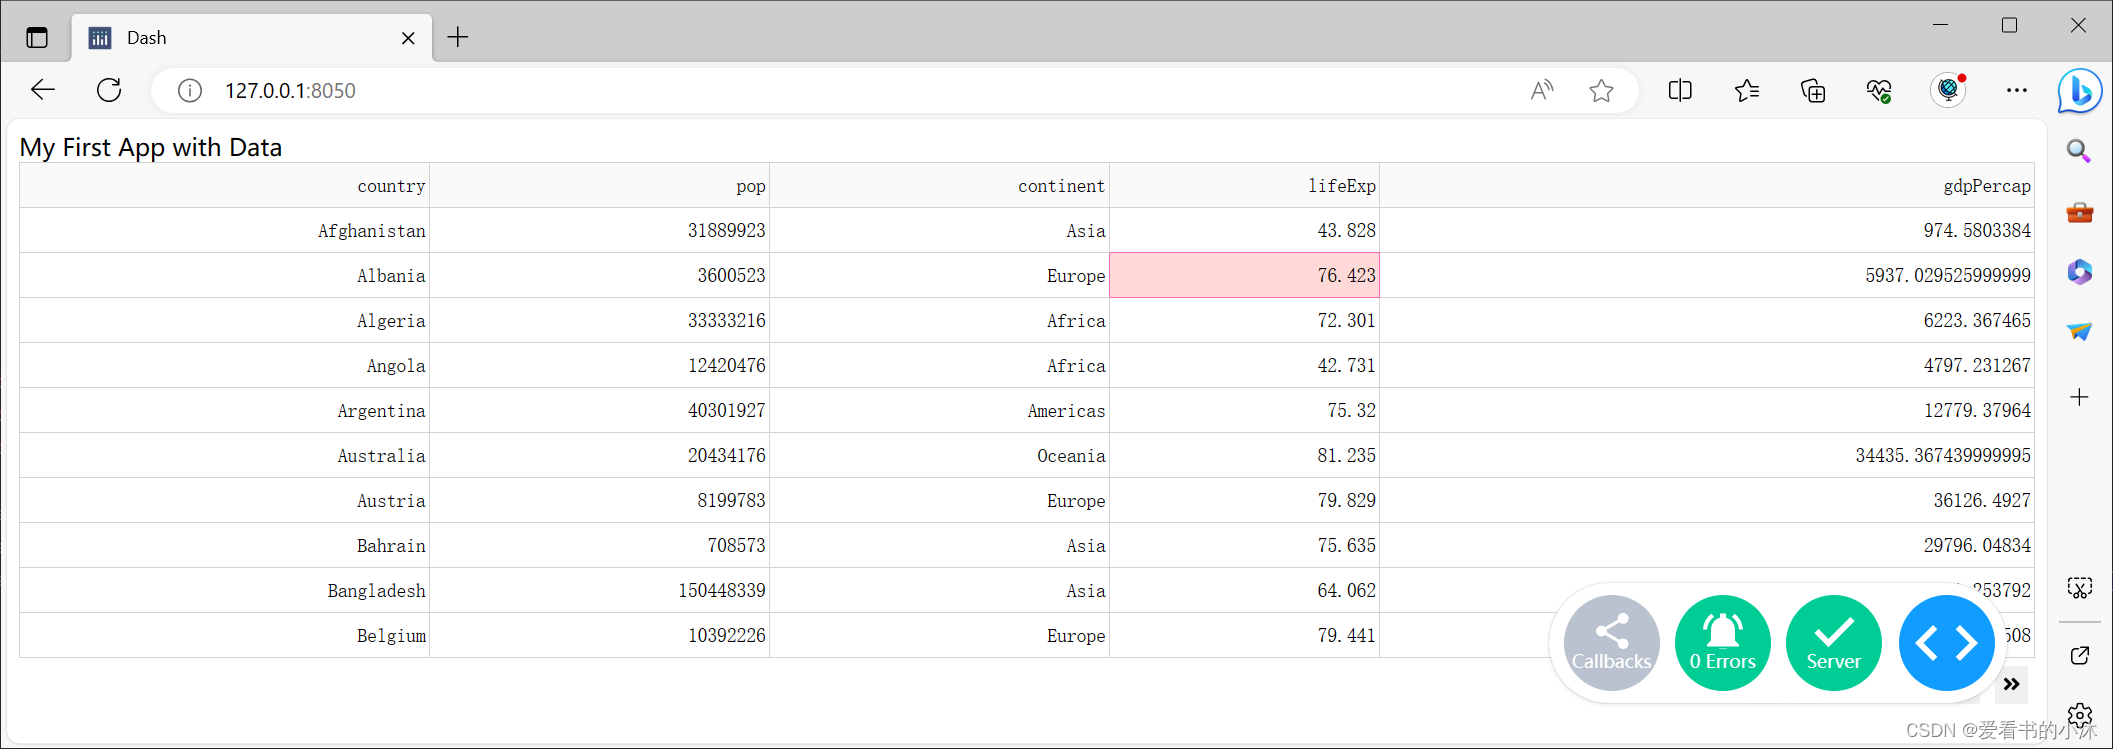
3.2 连接到数据
向应用添加数据的方法有很多种:API、外部数据库、本地文件、JSON 文件等。 在此示例中,我们将重点介绍合并 CSV 工作表中数据的最常见方法之一。
from dash import Dash, html, dash_table
import pandas as pd

# Incorporate data
df = pd.read_csv('https://raw.githubusercontent.com/plotly/datasets/master/gapminder2007.csv')# Initialize the app
app = Dash(__name__)# App layout
app.layout = html.Div([
    html.Div(children='My First App with Data'),
    dash_table.DataTable(data=df.to_dict('records'), page_size=10)])# Run the appif __name__ =='__main__':
    app.run(debug=True)
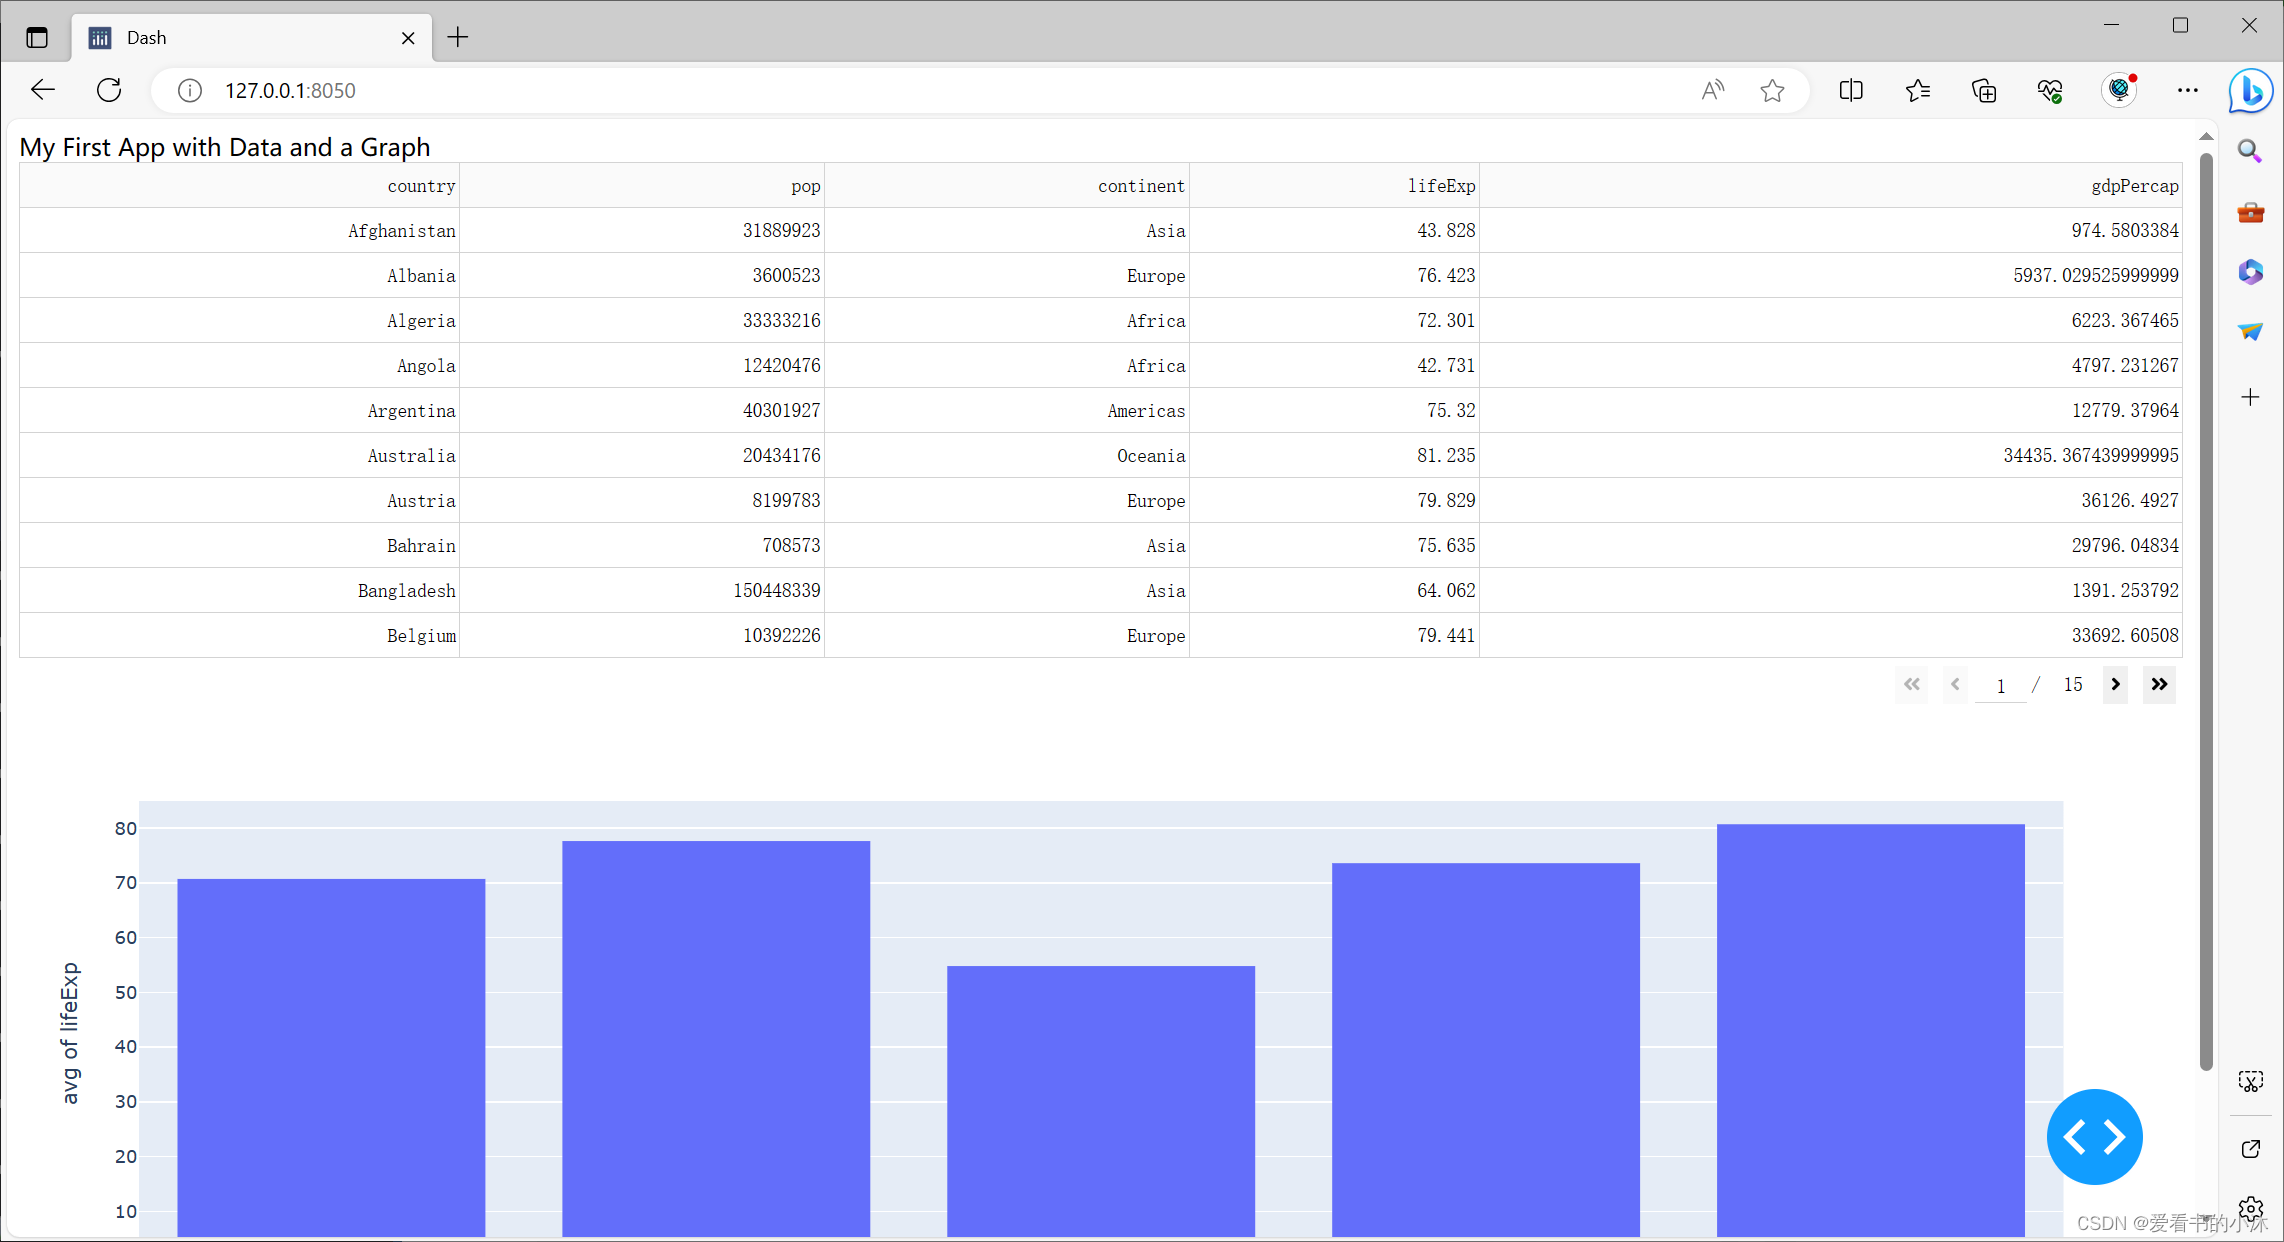
3.3 可视化数据
Plotly 图形库有 50 多种图表类型可供选择。 在此示例中,我们将使用直方图。
from dash import Dash, html, dash_table, dcc
import pandas as pd
import plotly.express as px

# Incorporate data
df = pd.read_csv('https://raw.githubusercontent.com/plotly/datasets/master/gapminder2007.csv')# Initialize the app
app = Dash(__name__)# App layout
app.layout = html.Div([
    html.Div(children='My First App with Data and a Graph'),
    dash_table.DataTable(data=df.to_dict('records'), page_size=10),
    dcc.Graph(figure=px.histogram(df, x='continent', y='lifeExp', histfunc='avg'))])# Run the appif __name__ =='__main__':
    app.run(debug=True)
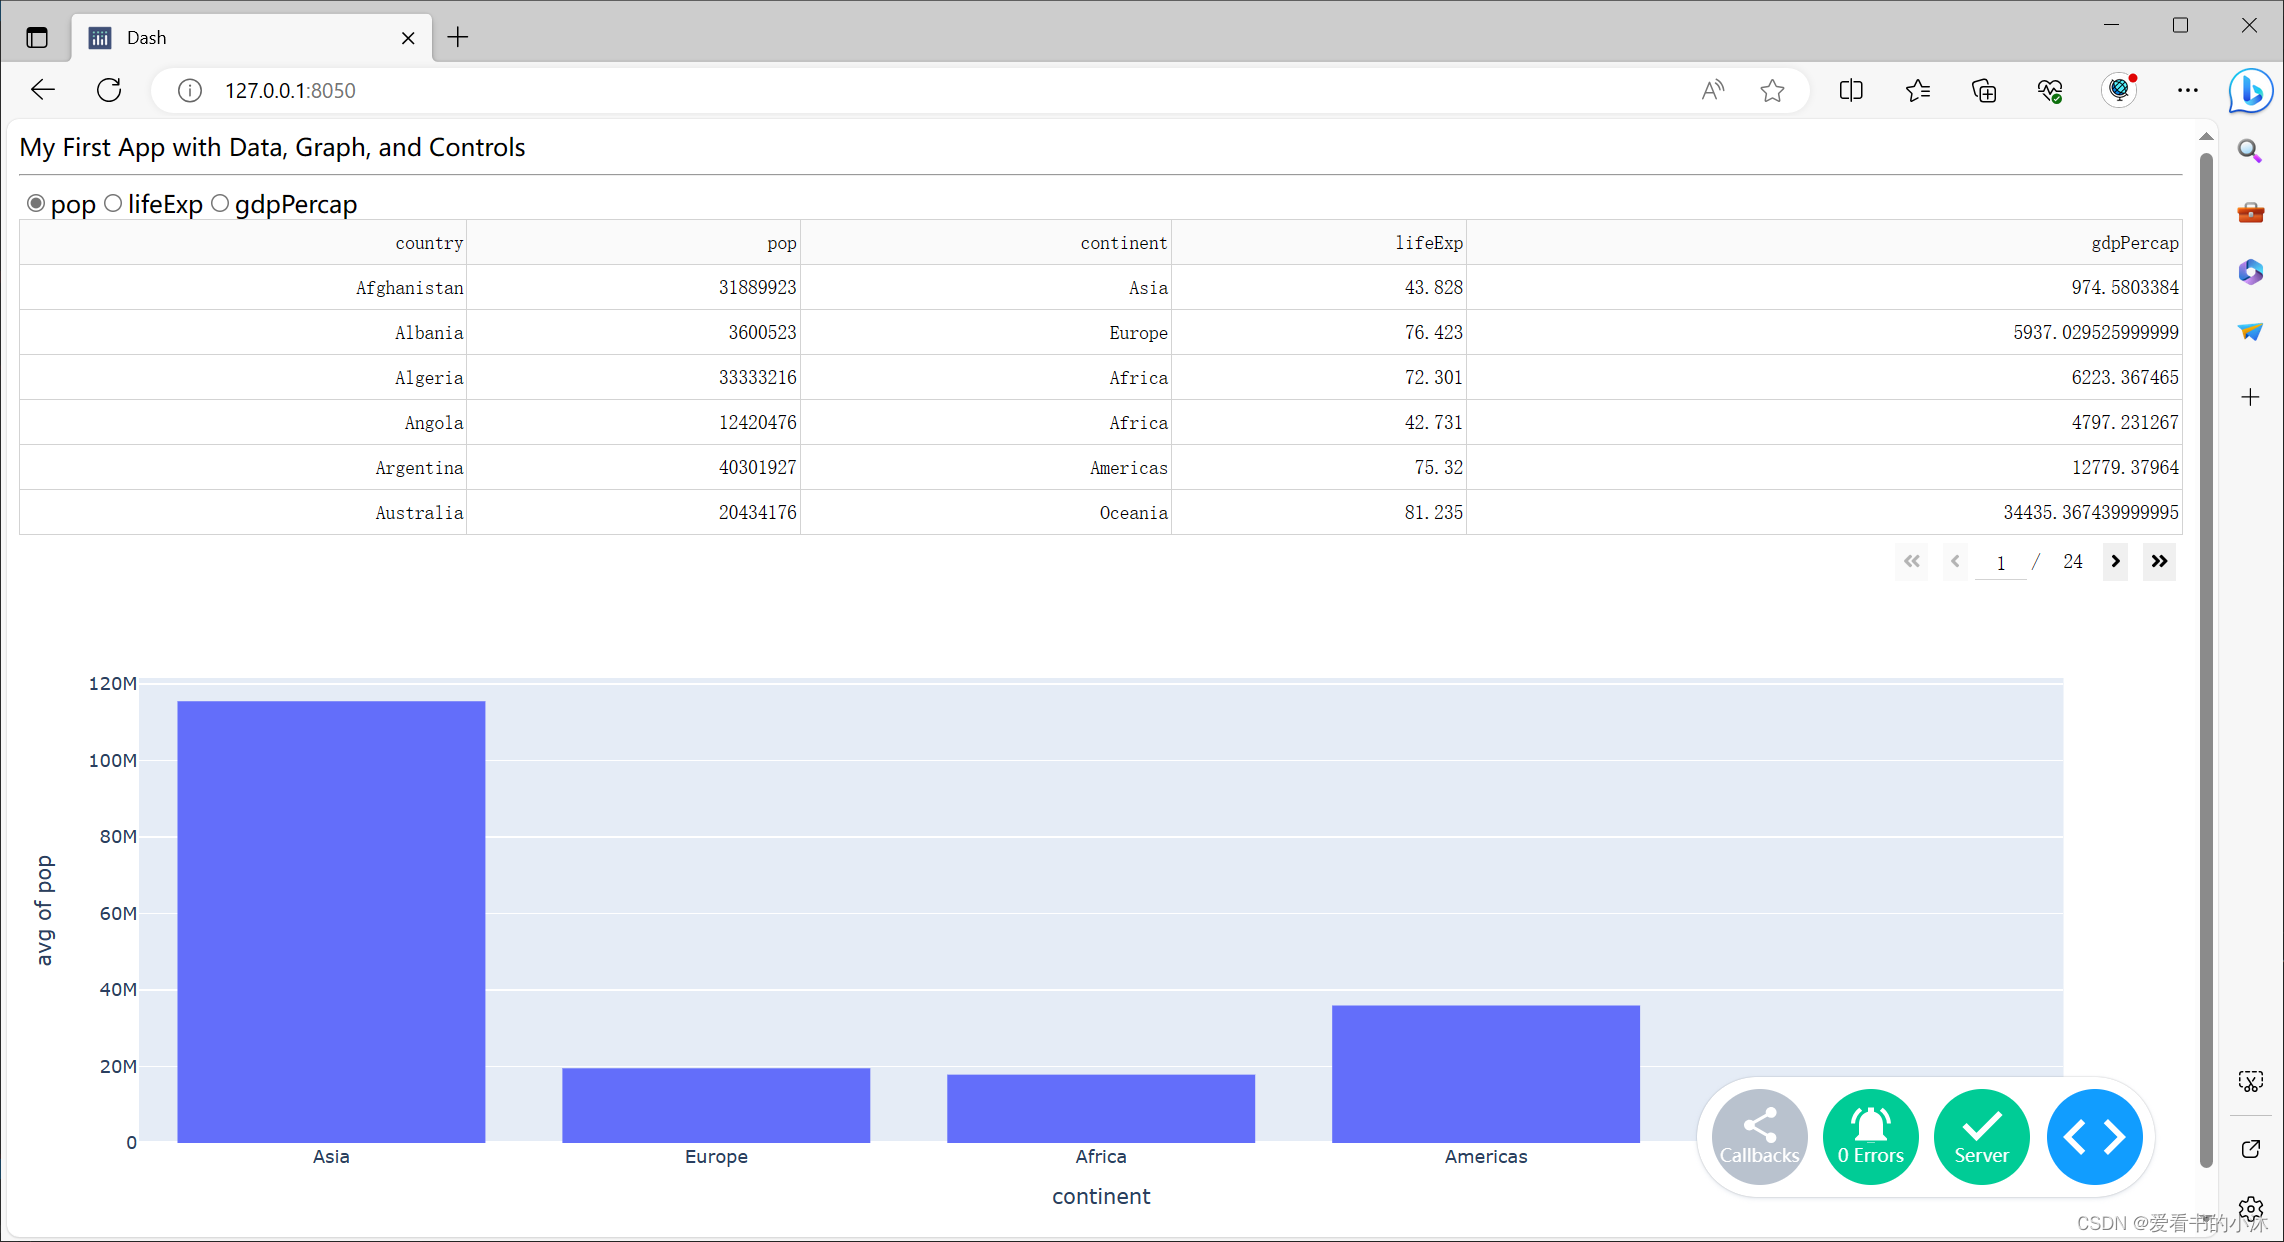
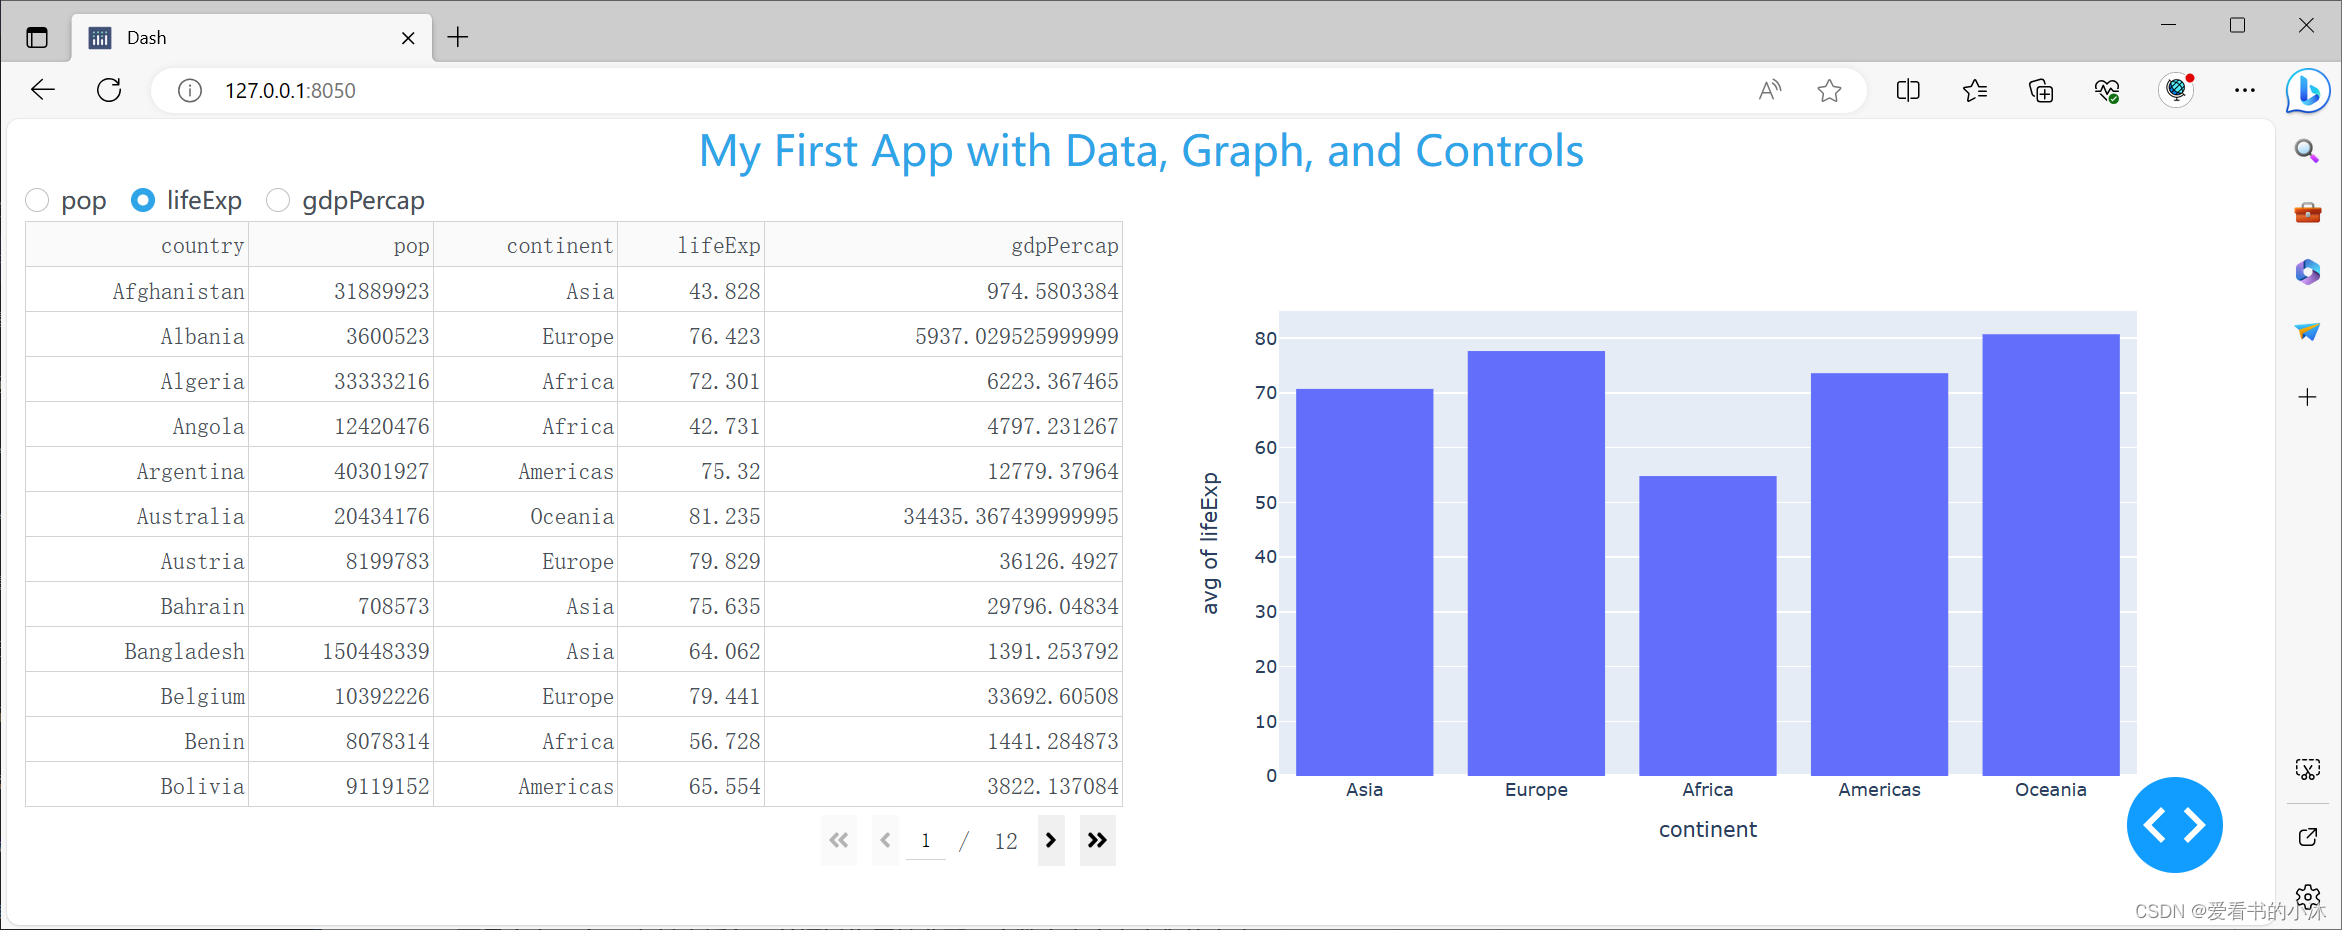
3.4 控件和回调
到目前为止,你已构建了一个显示表格数据和图形的静态应用。 但是,当您开发更复杂的Dash应用程序时,您可能希望为应用程序用户提供更多的自由来与应用程序交互并更深入地探索数据。 为此,需要使用回调函数向应用添加控件。
在此示例中,我们将向应用布局添加单选按钮。然后,我们将构建回调以创建单选按钮和直方图之间的交互。
from dash import Dash, html, dash_table, dcc, callback, Output, Input
import pandas as pd
import plotly.express as px

# Incorporate data
df = pd.read_csv('https://raw.githubusercontent.com/plotly/datasets/master/gapminder2007.csv')# Initialize the app
app = Dash(__name__)# App layout
app.layout = html.Div([
    html.Div(children='My First App with Data, Graph, and Controls'),
    html.Hr(),
    dcc.RadioItems(options=['pop','lifeExp','gdpPercap'], value='lifeExp',id='controls-and-radio-item'),
    dash_table.DataTable(data=df.to_dict('records'), page_size=6),
    dcc.Graph(figure={},id='controls-and-graph')])# Add controls to build the interaction@callback(
    Output(component_id='controls-and-graph', component_property='figure'),
    Input(component_id='controls-and-radio-item', component_property='value'))defupdate_graph(col_chosen):
    fig = px.histogram(df, x='continent', y=col_chosen, histfunc='avg')return fig

# Run the appif __name__ =='__main__':
    app.run(debug=True)
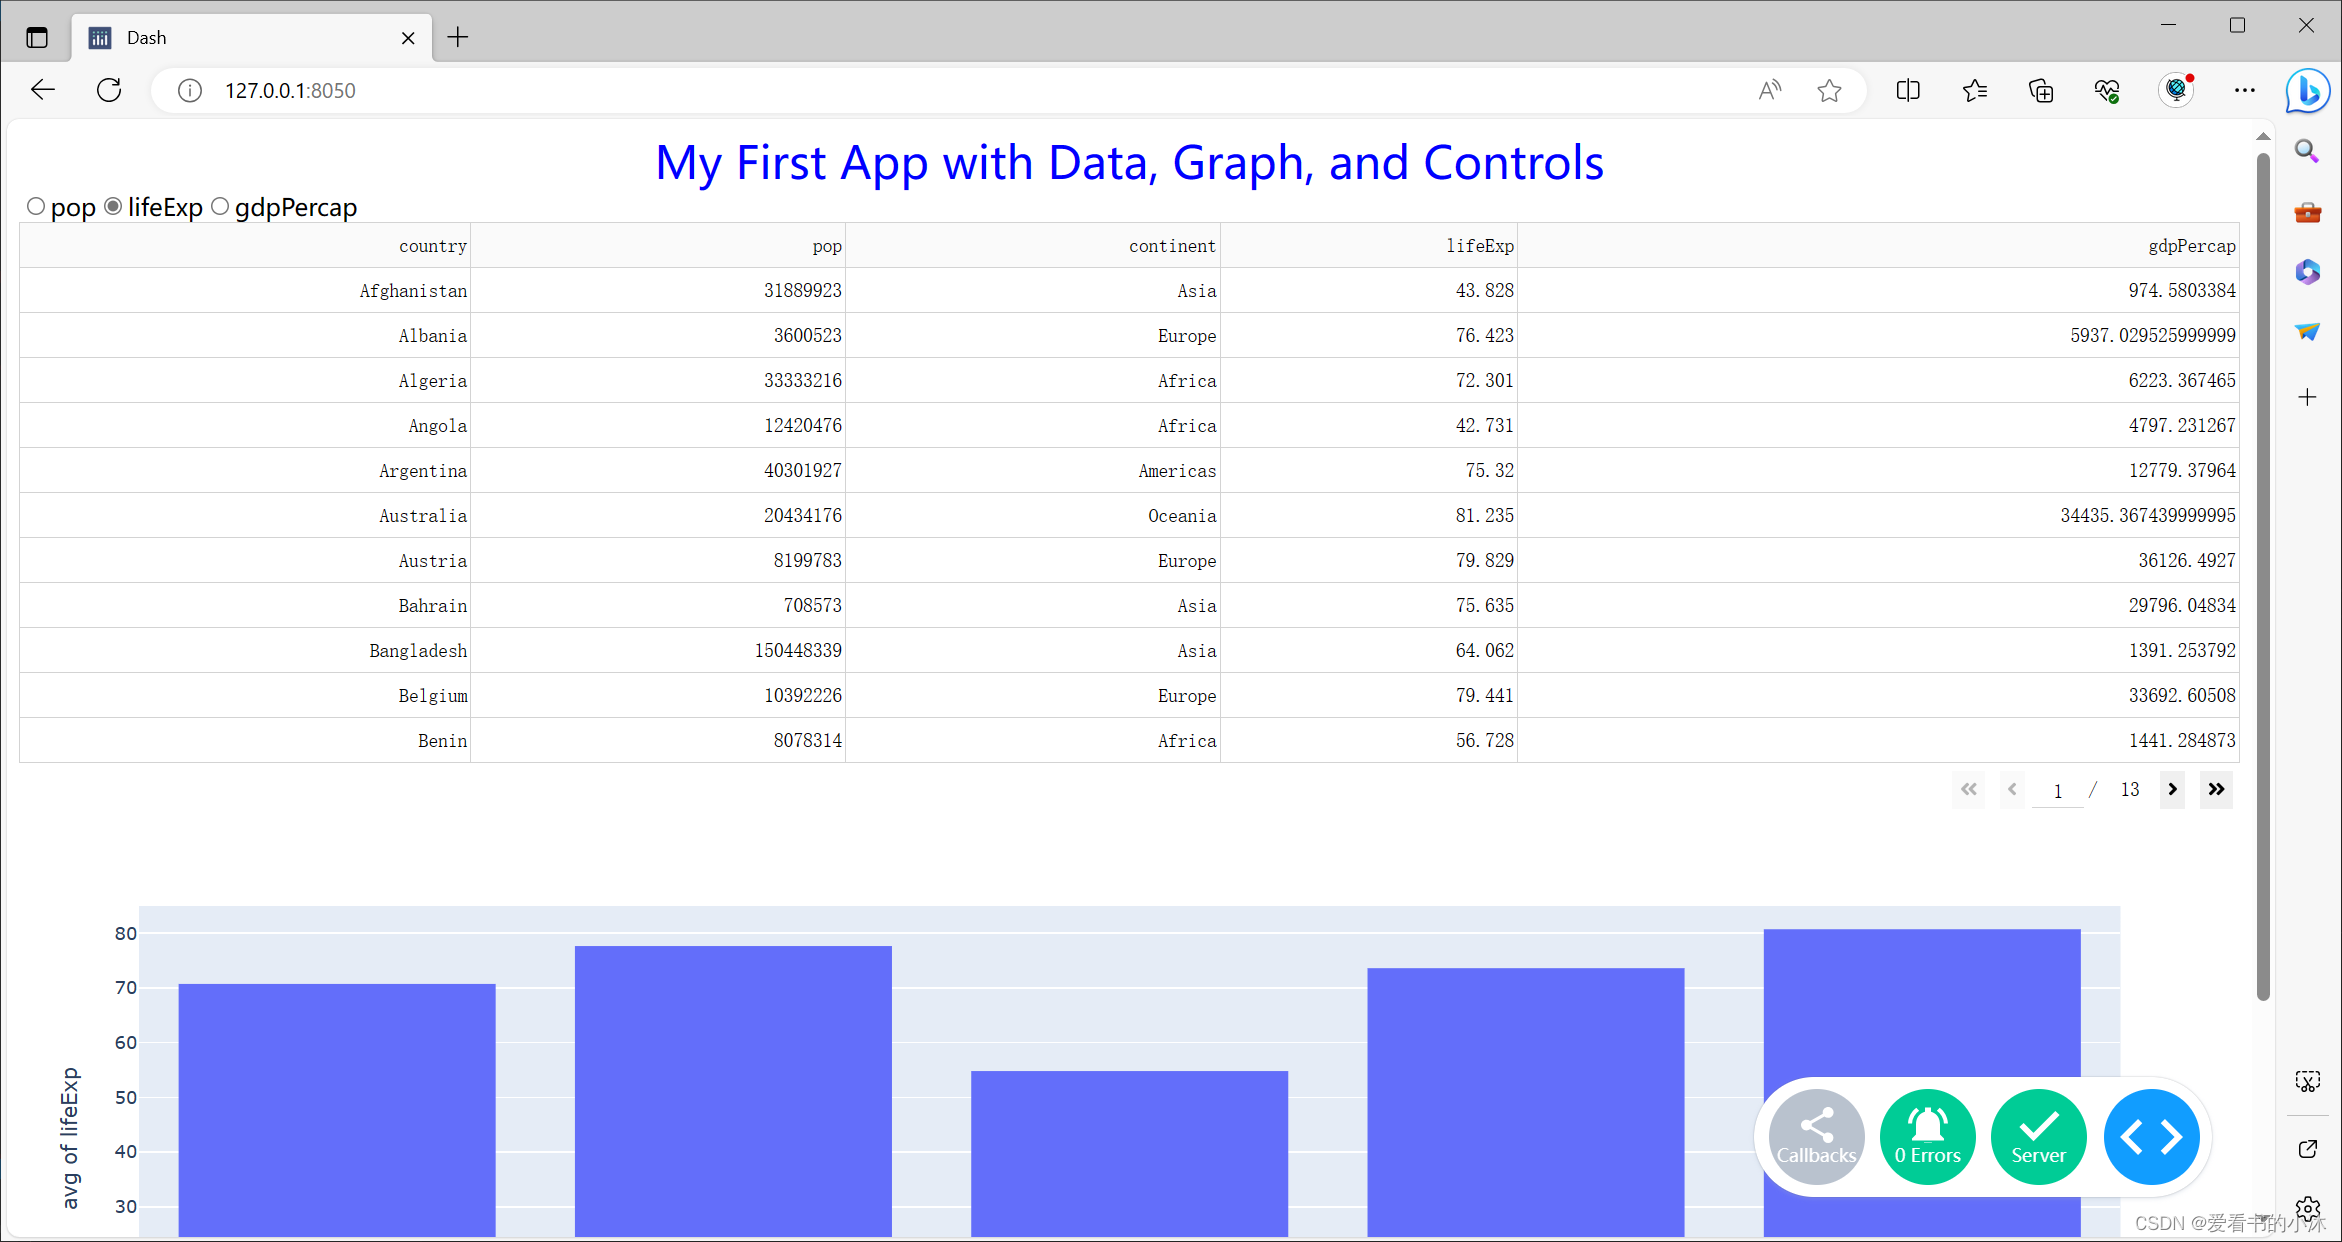
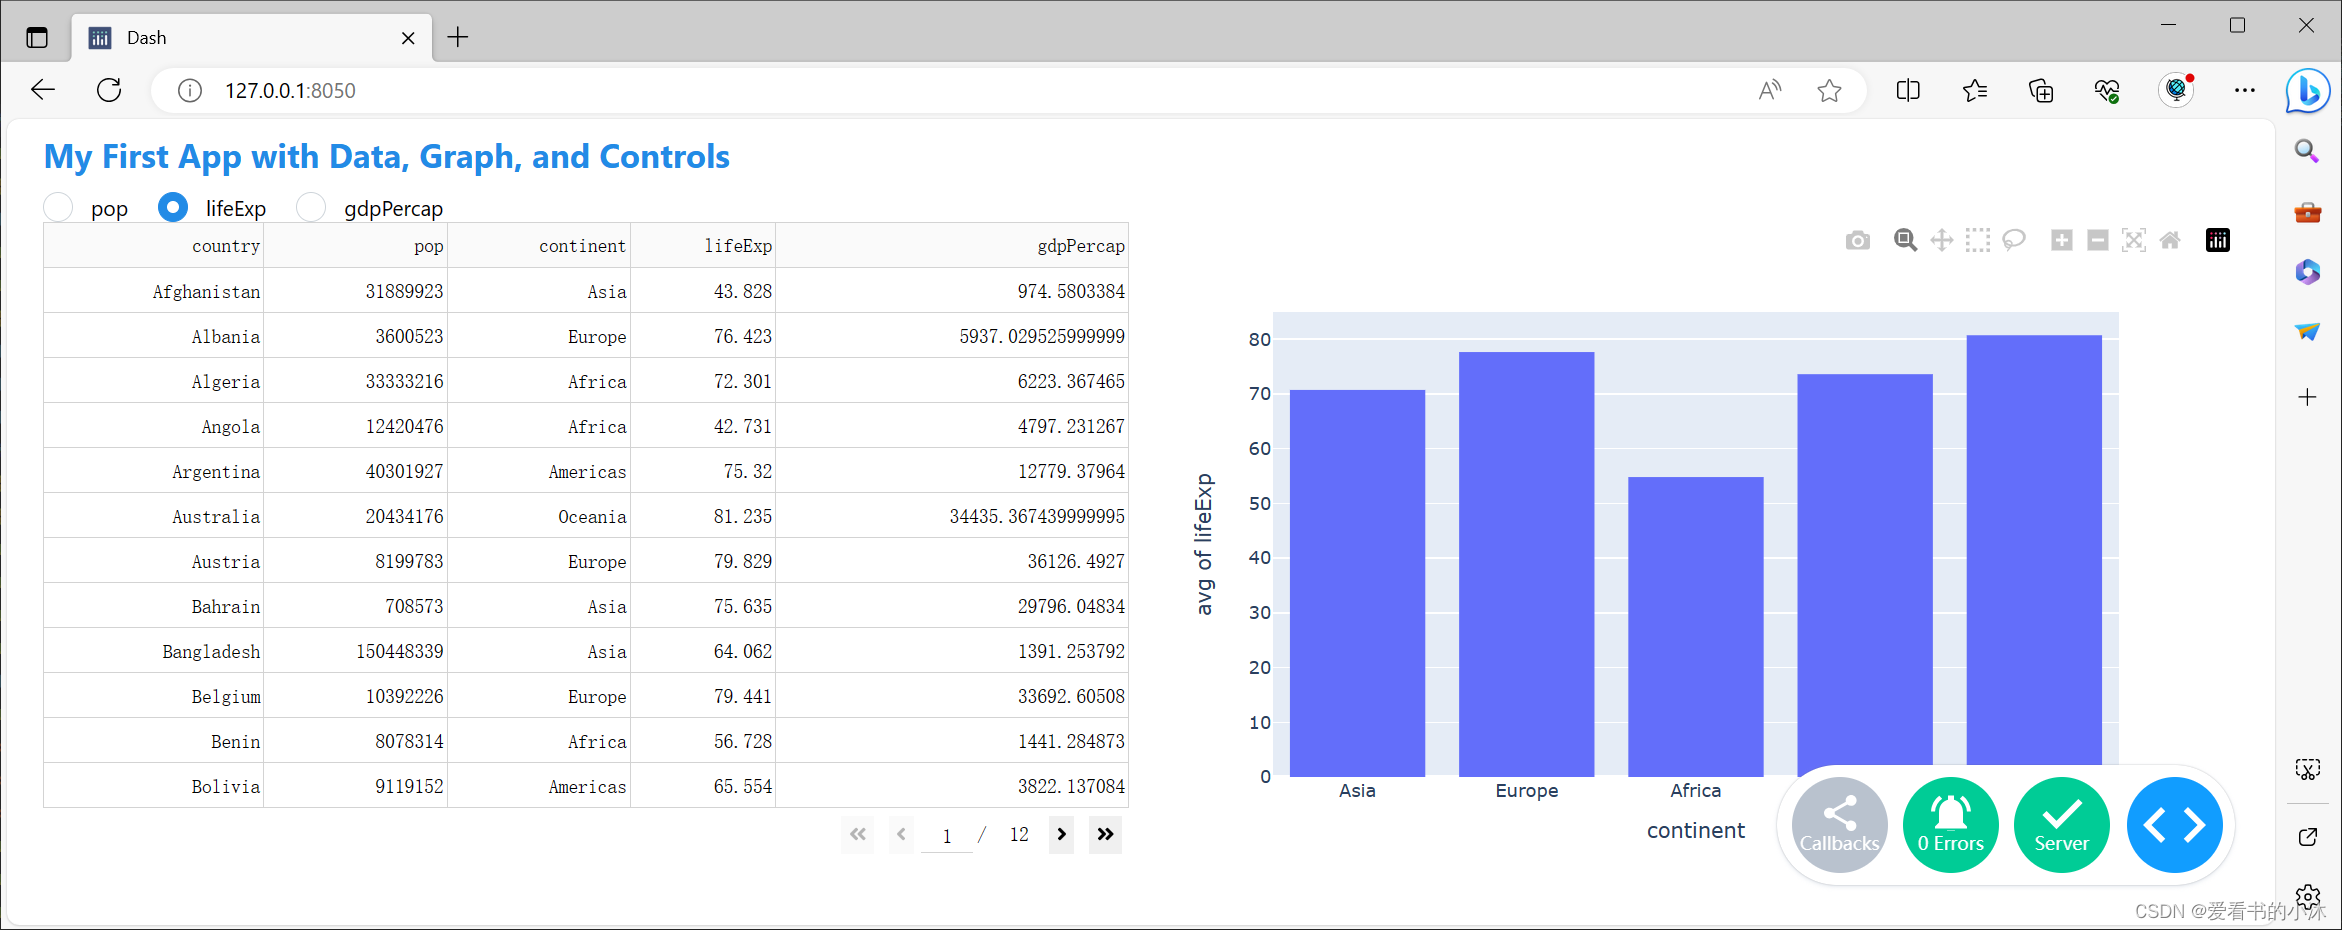
3.5 设置应用的样式
上一节中的示例使用Dash HTML组件来构建简单的应用程序布局,但您可以设置应用程序的样式以使其看起来更专业。
- 本节将简要概述可用于增强达世币应用程序布局样式的多种工具: - HTML and CSS- Dash Design Kit (DDK)- Dash Bootstrap Components- Dash Mantine Components
3.5.1 HTML and CSS
HTML 和 CSS 是在 Web 上呈现内容的最低级别的界面。 HTML 是一组组件,CSS 是应用于这些组件的一组样式。 CSS 样式可以通过属性在组件中应用,也可以将它们定义为引用属性的单独 CSS 文件.
from dash import Dash, html, dash_table, dcc, callback, Output, Input
import pandas as pd
import plotly.express as px

# Incorporate data
df = pd.read_csv('https://raw.githubusercontent.com/plotly/datasets/master/gapminder2007.csv')# Initialize the app - incorporate css
external_stylesheets =['https://codepen.io/chriddyp/pen/bWLwgP.css']
app = Dash(__name__, external_stylesheets=external_stylesheets)# App layout
app.layout = html.Div([
    html.Div(className='row', children='My First App with Data, Graph, and Controls',
             style={'textAlign':'center','color':'blue','fontSize':30}),

    html.Div(className='row', children=[
        dcc.RadioItems(options=['pop','lifeExp','gdpPercap'],
                       value='lifeExp',
                       inline=True,id='my-radio-buttons-final')]),

    html.Div(className='row', children=[
        html.Div(className='six columns', children=[
            dash_table.DataTable(data=df.to_dict('records'), page_size=11, style_table={'overflowX':'auto'})]),
        html.Div(className='six columns', children=[
            dcc.Graph(figure={},id='histo-chart-final')])])])# Add controls to build the interaction@callback(
    Output(component_id='histo-chart-final', component_property='figure'),
    Input(component_id='my-radio-buttons-final', component_property='value'))defupdate_graph(col_chosen):
    fig = px.histogram(df, x='continent', y=col_chosen, histfunc='avg')return fig

# Run the appif __name__ =='__main__':
    app.run(debug=True)
3.5.2 Dash Design Kit (DDK)
Dash 设计工具包是我们专为Dash 构建的高级UI框架。 使用Dash设计工具包,您无需使用HTML或CSS。默认情况下,应用程序是移动响应式的,并且一切都是主题化的。
请注意,如果没有Dash企业许可证,您将无法运行此示例。
from dash import Dash, html, dash_table, dcc, callback, Output, Input
import pandas as pd
import plotly.express as px
import dash_design_kit as ddk

# Incorporate data
df = pd.read_csv('https://raw.githubusercontent.com/plotly/datasets/master/gapminder2007.csv')# Initialize the app
app = Dash(__name__)# App layout
app.layout = ddk.App([
    ddk.Header(ddk.Title('My First App with Data, Graph, and Controls')),
    dcc.RadioItems(options=['pop','lifeExp','gdpPercap'],
                    value='lifeExp',
                    inline=True,id='my-ddk-radio-items-final'),
    ddk.Row([
        ddk.Card([
            dash_table.DataTable(data=df.to_dict('records'), page_size=12, style_table={'overflowX':'auto'})], width=50),
        ddk.Card([
            ddk.Graph(figure={},id='graph-placeholder-ddk-final')], width=50),]),])# Add controls to build the interaction@callback(
    Output(component_id='graph-placeholder-ddk-final', component_property='figure'),
    Input(component_id='my-ddk-radio-items-final', component_property='value'))defupdate_graph(col_chosen):
    fig = px.histogram(df, x='continent', y=col_chosen, histfunc='avg')return fig

# Run the appif __name__ =='__main__':
    app.run(debug=True)
3.5.3 Dash Bootstrap Components
Dash Bootstrap是一个基于引导组件系统构建的社区维护库。 虽然它没有被Plotly官方维护或支持,但Dash Bootstrap是构建优雅应用程序布局的强大方式。 请注意,我们首先定义一行,然后使用 and 组件定义行内列的宽度。
pip install dash-bootstrap-components
# Import packagesfrom dash import Dash, html, dash_table, dcc, callback, Output, Input
import pandas as pd
import plotly.express as px
import dash_bootstrap_components as dbc

# Incorporate data
df = pd.read_csv('https://raw.githubusercontent.com/plotly/datasets/master/gapminder2007.csv')# Initialize the app - incorporate a Dash Bootstrap theme
external_stylesheets =[dbc.themes.CERULEAN]
app = Dash(__name__, external_stylesheets=external_stylesheets)# App layout
app.layout = dbc.Container([
    dbc.Row([
        html.Div('My First App with Data, Graph, and Controls', className="text-primary text-center fs-3")]),

    dbc.Row([
        dbc.RadioItems(options=[{"label": x,"value": x}for x in['pop','lifeExp','gdpPercap']],
                       value='lifeExp',
                       inline=True,id='radio-buttons-final')]),

    dbc.Row([
        dbc.Col([
            dash_table.DataTable(data=df.to_dict('records'), page_size=12, style_table={'overflowX':'auto'})], width=6),

        dbc.Col([
            dcc.Graph(figure={},id='my-first-graph-final')], width=6),]),], fluid=True)# Add controls to build the interaction@callback(
    Output(component_id='my-first-graph-final', component_property='figure'),
    Input(component_id='radio-buttons-final', component_property='value'))defupdate_graph(col_chosen):
    fig = px.histogram(df, x='continent', y=col_chosen, histfunc='avg')return fig

# Run the appif __name__ =='__main__':
    app.run(debug=True)
3.5.4 Dash Mantine Components
Dash Mantine是一个社区维护的库,建立在Mantine组件系统之上。 虽然它没有得到Plotly团队的官方维护或支持,但Dash Mantine是另一种自定义应用程序布局的强大方式。 破折号组件使用网格模块来构建布局。
pip install dash-mantine-components

from dash import Dash, html, dash_table, dcc, callback, Output, Input
import pandas as pd
import plotly.express as px
import dash_mantine_components as dmc

# Incorporate data
df = pd.read_csv('https://raw.githubusercontent.com/plotly/datasets/master/gapminder2007.csv')# Initialize the app - incorporate a Dash Mantine theme
external_stylesheets =[dmc.theme.DEFAULT_COLORS]
app = Dash(__name__, external_stylesheets=external_stylesheets)# App layout
app.layout = dmc.Container([
    dmc.Title('My First App with Data, Graph, and Controls', color="blue", size="h3"),
    dmc.RadioGroup([dmc.Radio(i, value=i)for i in['pop','lifeExp','gdpPercap']],id='my-dmc-radio-item',
            value='lifeExp',
            size="sm"),
    dmc.Grid([
        dmc.Col([
            dash_table.DataTable(data=df.to_dict('records'), page_size=12, style_table={'overflowX':'auto'})], span=6),
        dmc.Col([
            dcc.Graph(figure={},id='graph-placeholder')], span=6),]),], fluid=True)# Add controls to build the interaction@callback(
    Output(component_id='graph-placeholder', component_property='figure'),
    Input(component_id='my-dmc-radio-item', component_property='value'))defupdate_graph(col_chosen):
    fig = px.histogram(df, x='continent', y=col_chosen, histfunc='avg')return fig

# Run the Appif __name__ =='__main__':
    app.run(debug=True)
4、更多示例
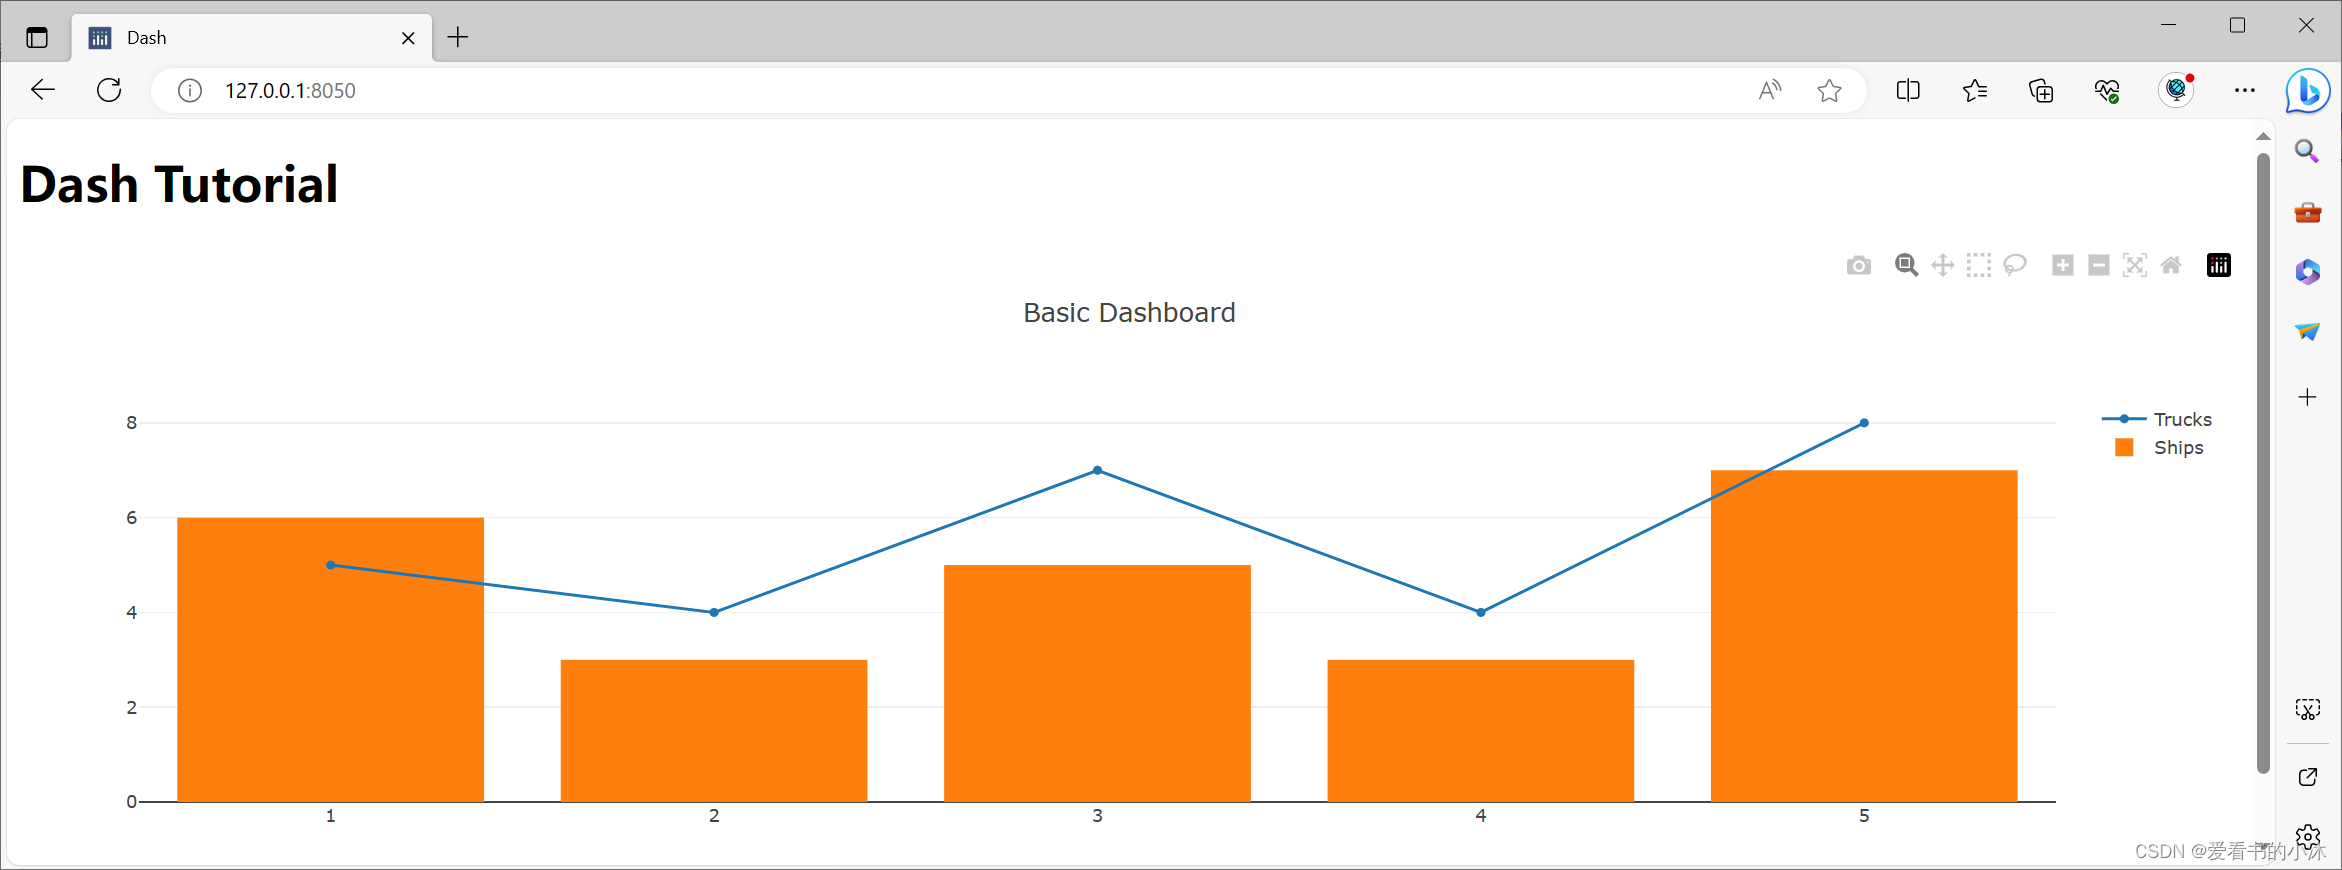
4.1 Basic Dashboard
import dash
import dash_core_components as dcc
import dash_html_components as html

app = dash.Dash()

app.layout = html.Div(children =[
    html.H1("Dash Tutorial"),
    dcc.Graph(id="example",
        figure ={'data':[{'x':[1,2,3,4,5],'y':[5,4,7,4,8],'type':'line','name':'Trucks'},{'x':[1,2,3,4,5],'y':[6,3,5,3,7],'type':'bar','name':'Ships'}],'layout':{'title':'Basic Dashboard'}})])if __name__ =='__main__':
    app.run_server()
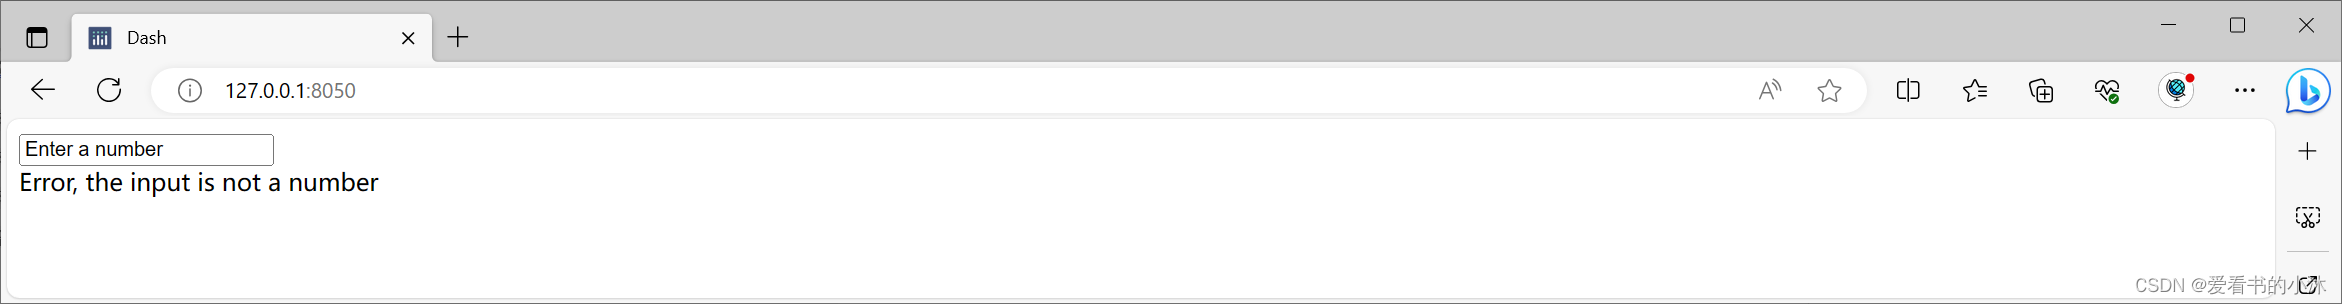
4.2 Using Callbacks
import dash
import dash_core_components as dcc
import dash_html_components as html
from dash.dependencies import Input, Output

app = dash.Dash()

app.layout = html.Div(children =[
    dcc.Input(id='input',
              value ='Enter a number',type='text'),

    html.Div(id='output')])@app.callback(
    Output(component_id ='output', component_property ='children'),[Input(component_id ='input', component_property ='value')])defupdate_value(input_data):try:returnstr(float(input_data)**2)except:return"Error, the input is not a number"if __name__ =='__main__':
    app.run_server()
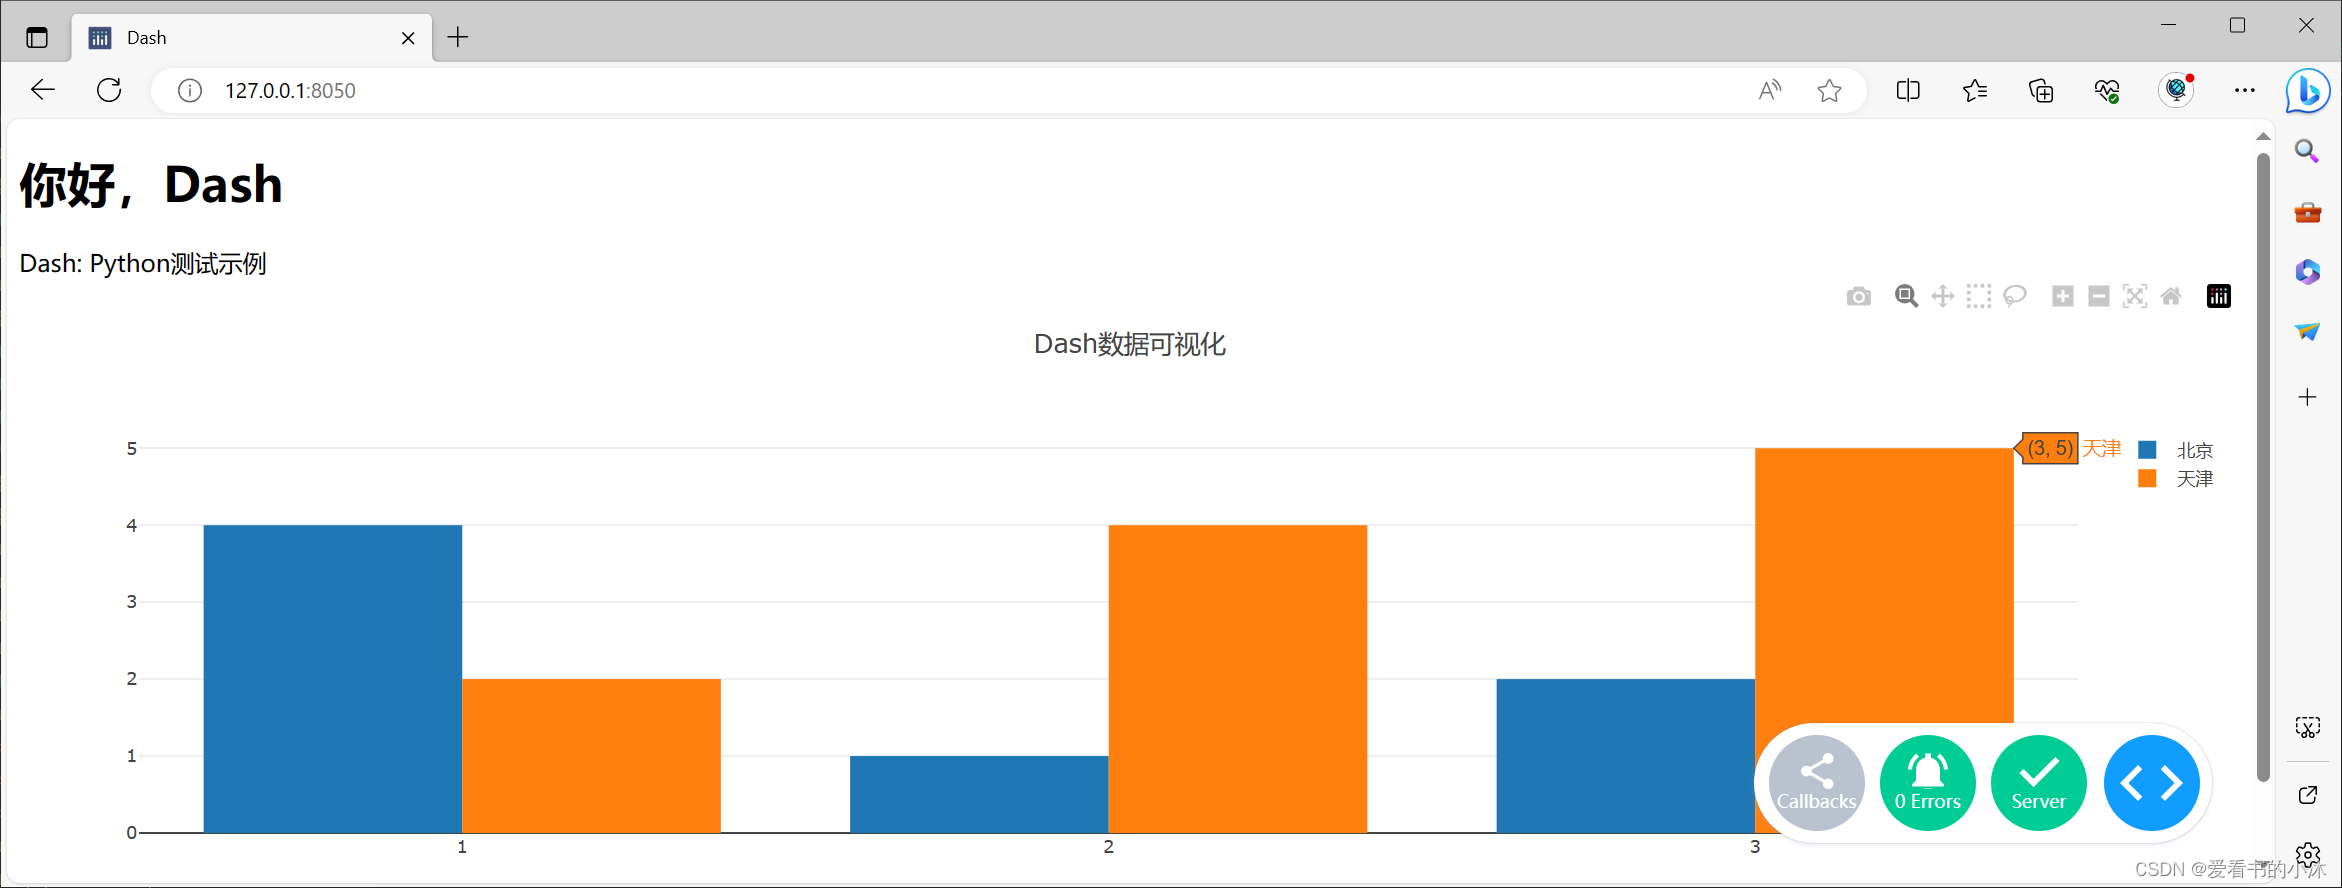
4.3 使用Dash生成HTML
# -*- coding: utf-8 -*-import dash
import dash_core_components as dcc
import dash_html_components as html

app = dash.Dash()

app.layout = html.Div(children=[
    html.H1(children='你好,Dash'),

    html.Div(children='''
        Dash: Python测试示例'''),

    dcc.Graph(id='example-graph',
        figure={'data':[{'x':[1,2,3],'y':[4,1,2],'type':'bar','name':'北京'},{'x':[1,2,3],'y':[2,4,5],'type':'bar','name':'天津'},],'layout':{'title':'Dash数据可视化'}})])if __name__ =='__main__':
    app.run_server(debug=True)
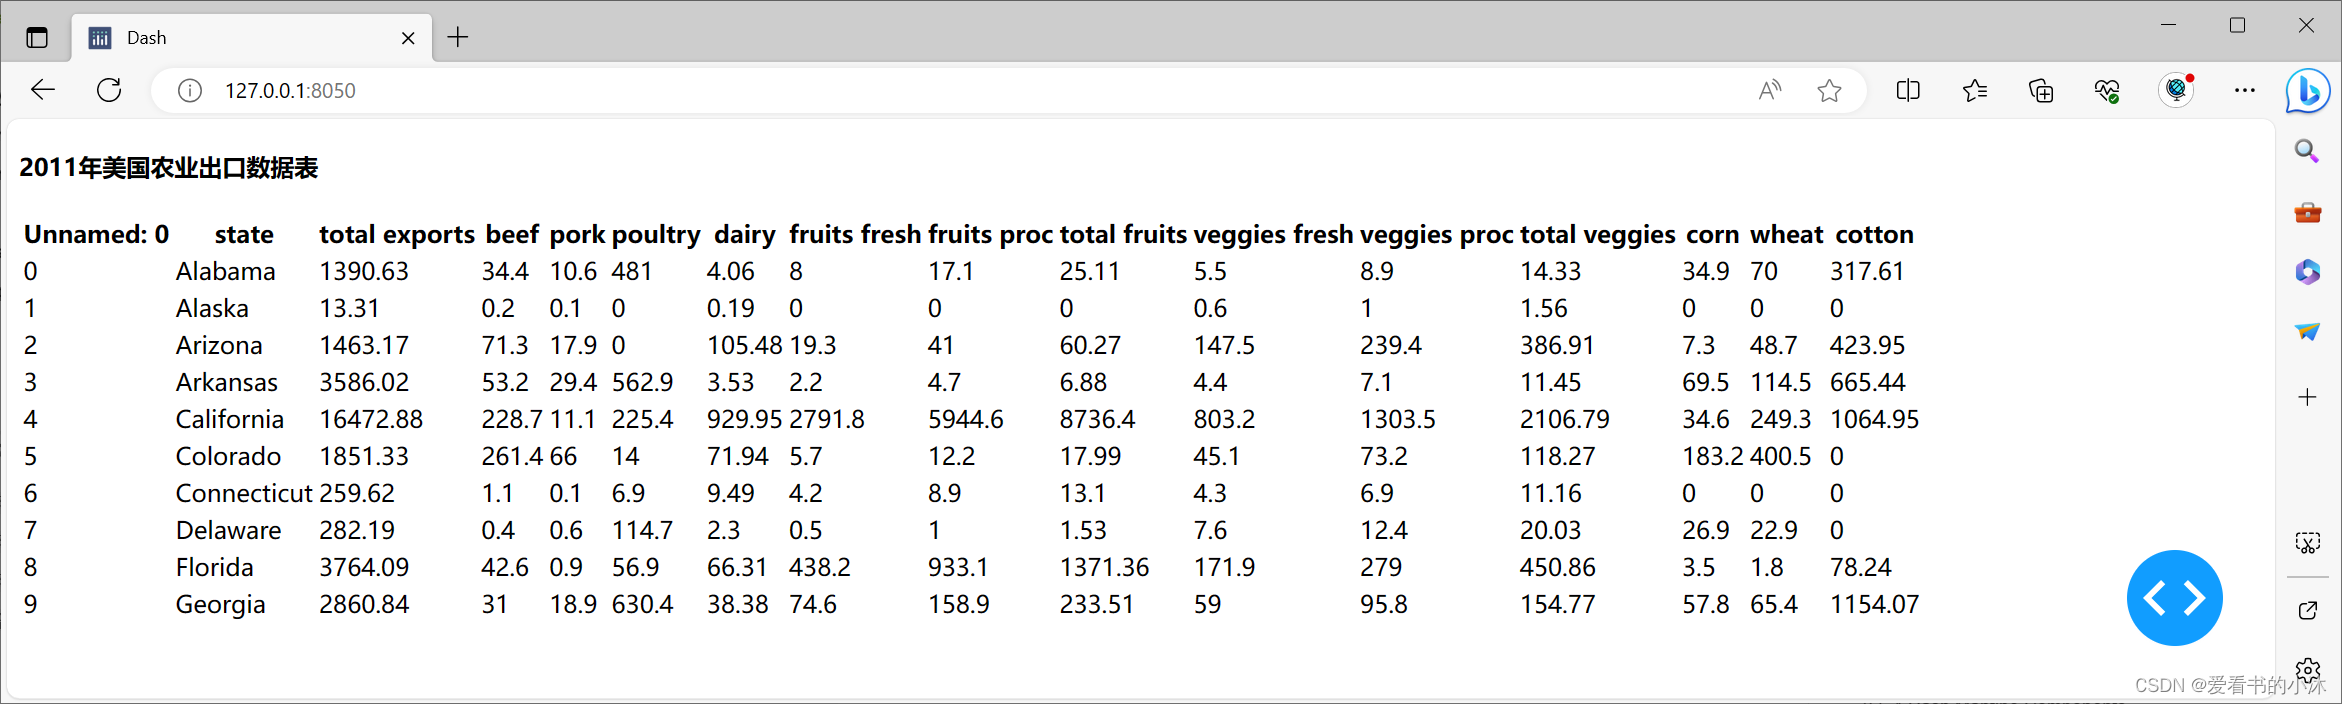
4.4 可复用组件
# -*- coding: utf-8 -*-import dash
import dash_core_components as dcc
import dash_html_components as html
import pandas as pd

df = pd.read_csv('https://gist.githubusercontent.com/chriddyp/''c78bf172206ce24f77d6363a2d754b59/raw/''c353e8ef842413cae56ae3920b8fd78468aa4cb2/''usa-agricultural-exports-2011.csv')defgenerate_talbe(dataframe, max_rows=10):return html.Table(# Header[html.Tr([html.Th(col)for col in dataframe.columns])]+# Body[html.Tr([
            html.Td(dataframe.iloc[i][col])for col in dataframe.columns
        ])for i inrange(min(len(dataframe), max_rows))])

app = dash.Dash()

app.css.append_css({"external_url":"https://codepen.io/chriddyp/pen/bWLwgP.css"})

app.layout = html.Div(children=[
    html.H4(children='2011年美国农业出口数据表'),
    generate_talbe(df)])if __name__ =='__main__':
    app.run_server(debug=True)
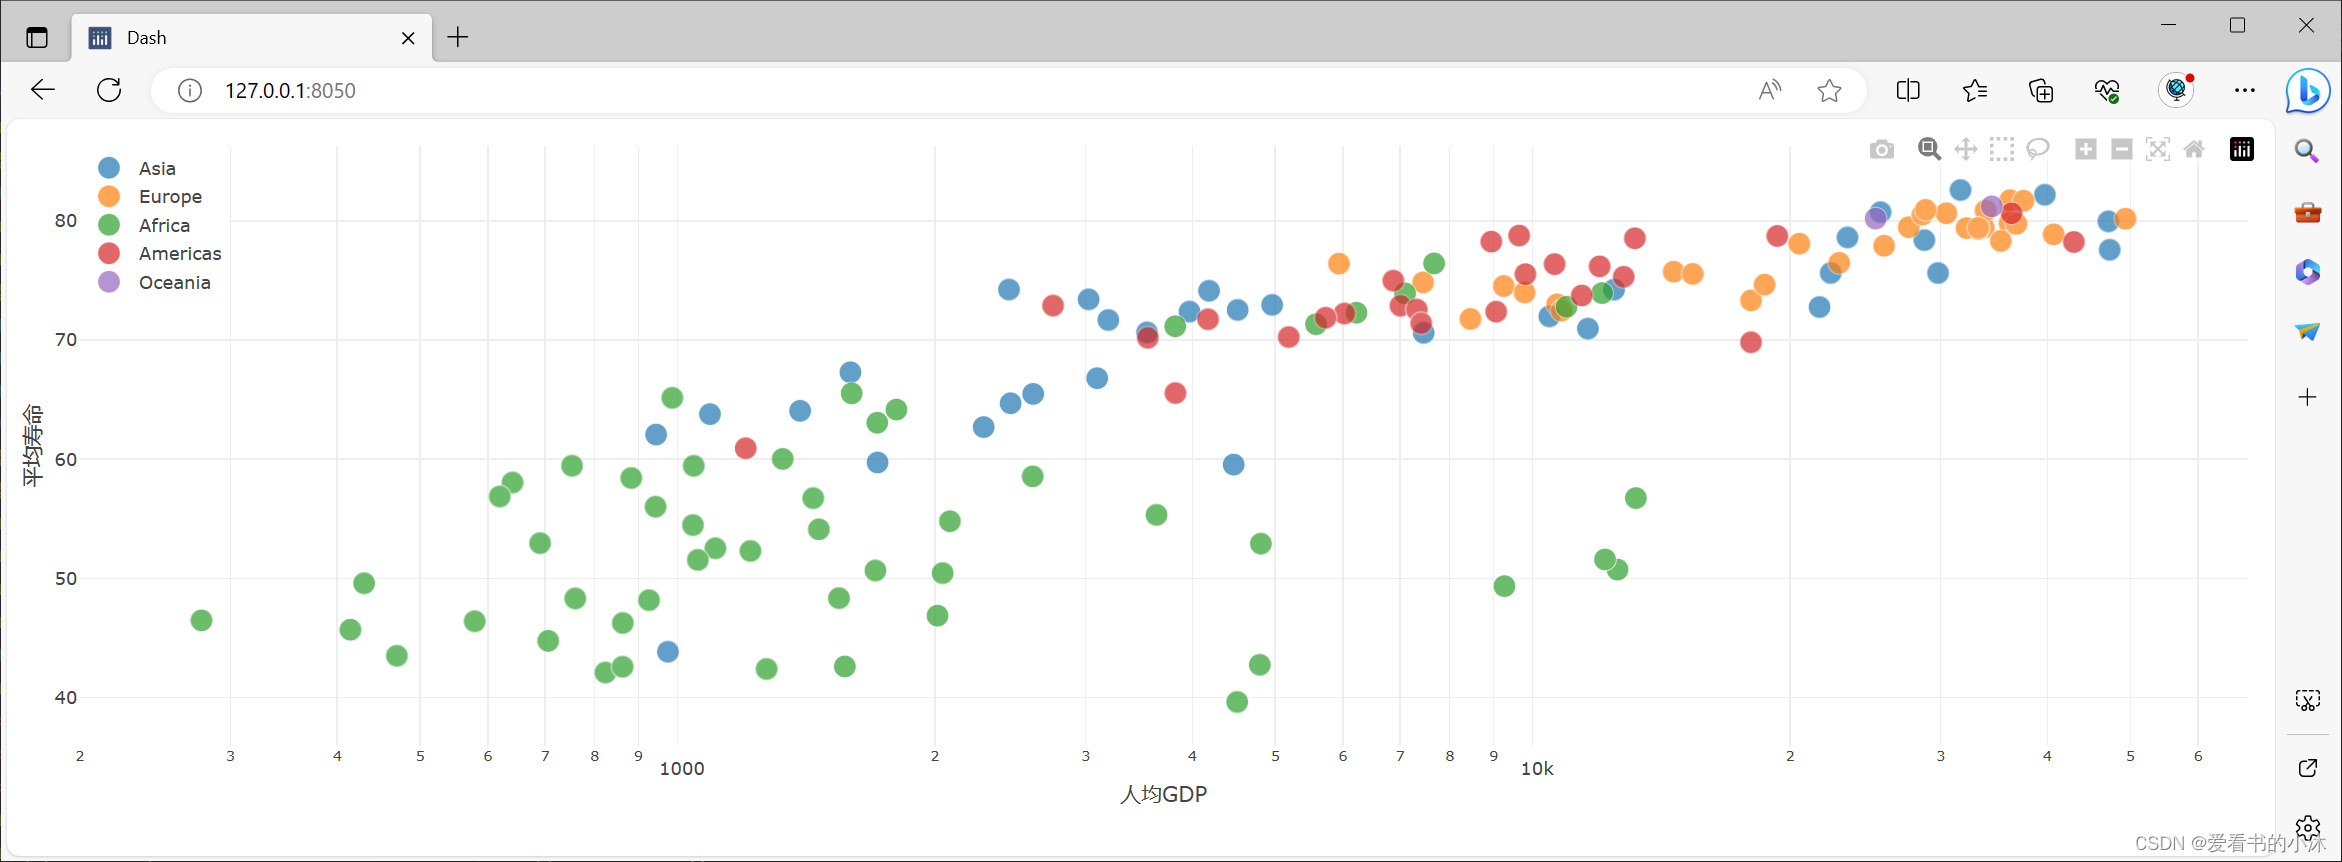
4.5 可视化示例
# -*- coding: utf-8 -*-import dash
import pandas as pd
import plotly.graph_objs as go
import dash_core_components as dcc
import dash_html_components as html

app = dash.Dash()

df = pd.read_csv('https://gist.githubusercontent.com/chriddyp/'+'5d1ea79569ed194d432e56108a04d188/raw/'+'a9f9e8076b837d541398e999dcbac2b2826a81f8/'+'gdp-life-exp-2007.csv')

app.layout = html.Div([
    dcc.Graph(id='life-exp-vs-gdp',
        figure={'data':[
                go.Scatter(
                    x=df[df['continent']== i]['gdp per capita'],
                    y=df[df['continent']== i]['life expectancy'],
                    text=df[df['continent']== i]['country'],
                    mode='markers',
                    opacity=0.7,
                    marker={'size':15,'line':{'width':0.5,'color':'white'}},
                    name=i
                )for i in df.continent.unique()],'layout': go.Layout(
                xaxis={'type':'log','title':'人均GDP'},
                yaxis={'title':'平均寿命'},
                margin={'l':40,'b':40,'t':10,'r':10},
                legend={'x':0,'y':1},
                hovermode='closest')})])if __name__ =='__main__':
    app.run_server()
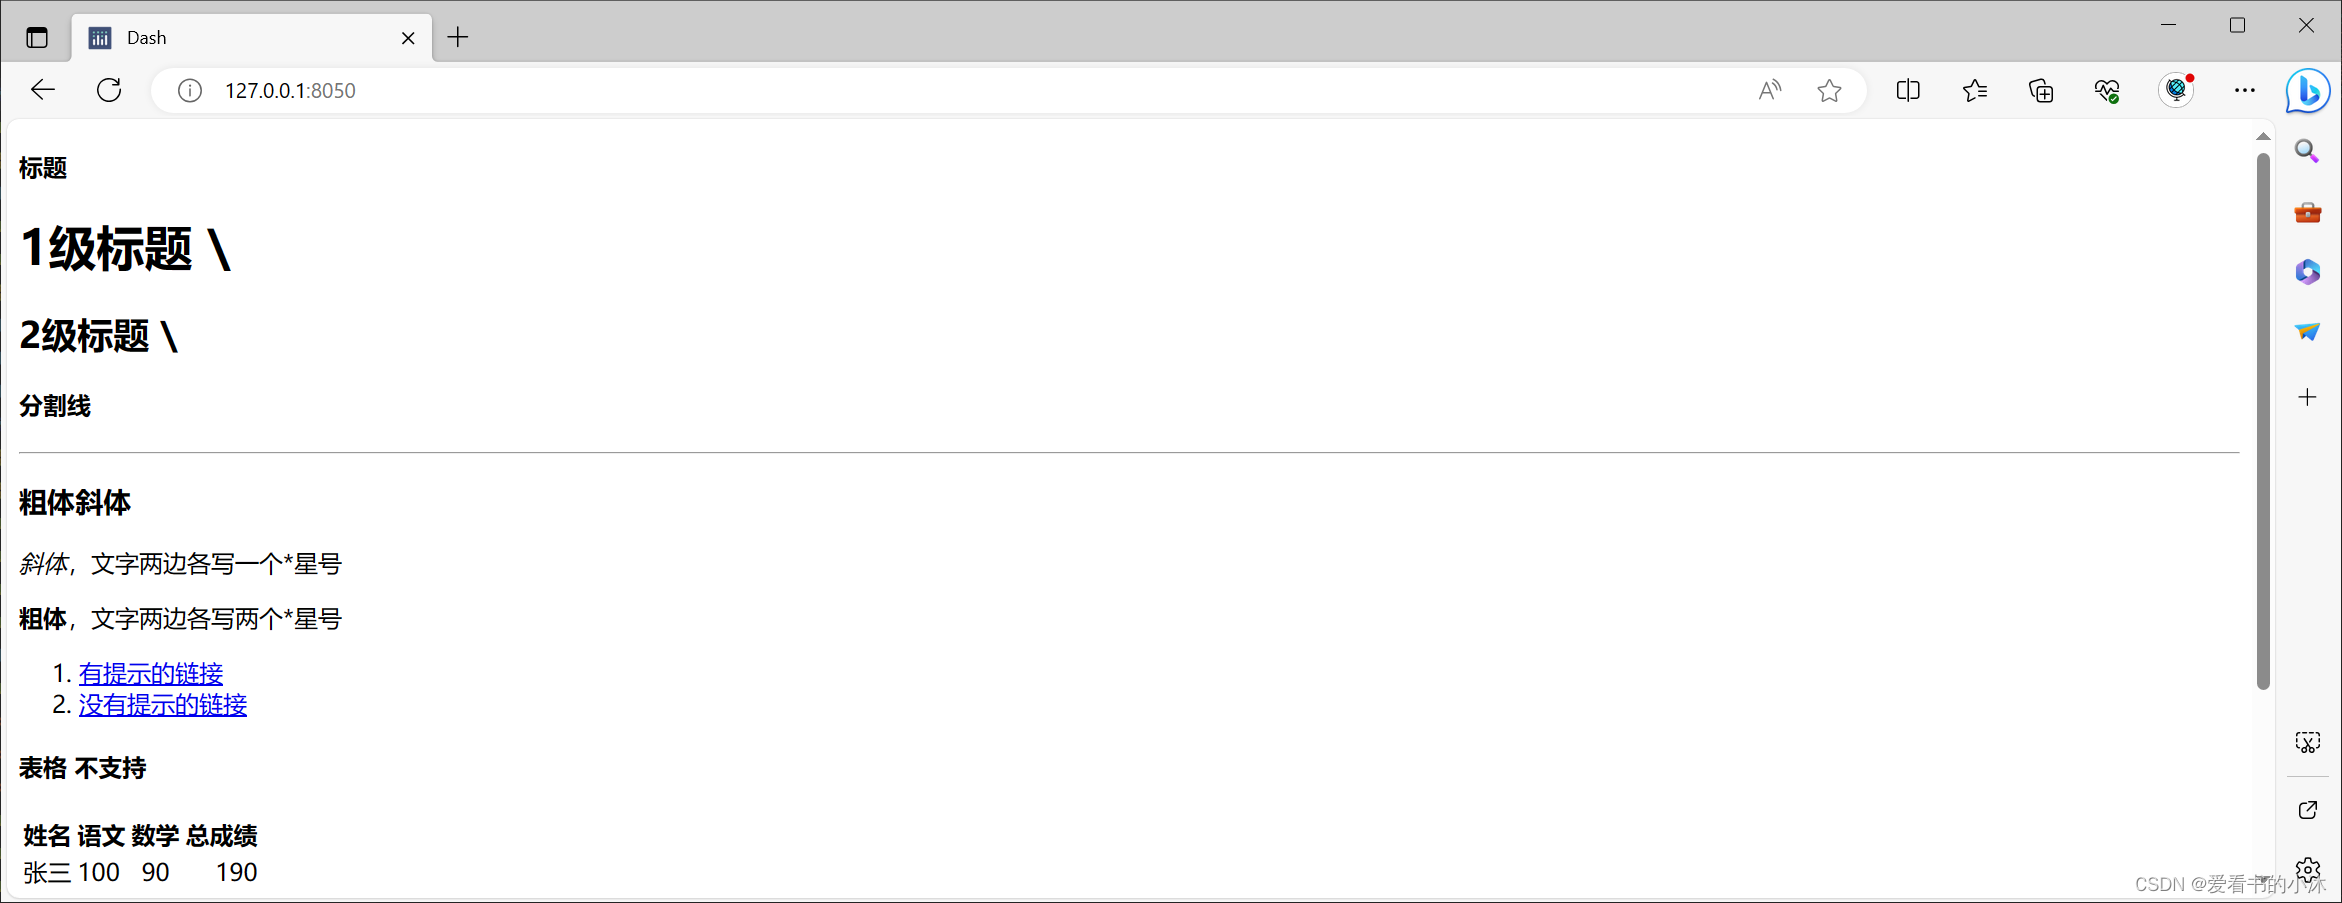
4.6 Dash与Markdown
# -*- coding: utf-8 -*-import dash_core_components as dcc
import dash_html_components as html
import dash

app = dash.Dash()

Markdown_text ='''
#### 标题
# 1级标题 \#
## 2级标题 \##

#### 分割线
***

### 粗体斜体
*斜体*,文字两边各写一个\*星号

**粗体**,文字两边各写两个\*星号

1. [有提示的链接](http://url.com/ "有提示的链接")
2. [没有提示的链接](http://url.com/)

#### 表格 不支持
姓名|语文|数学|总成绩
---|:---|:---:|---:
张三|100|90|190

#### 引用文字
使用\>是一级引用,使用两个>,即>>,是引用里面的引用
>引用文字
>>引用里面的引用
'''

app.css.append_css({"external_url":"https://codepen.io/chriddyp/pen/bWLwgP.css"})

app.layout = html.Div([
    dcc.Markdown(children=Markdown_text)])if __name__ =='__main__':
    app.run_server()
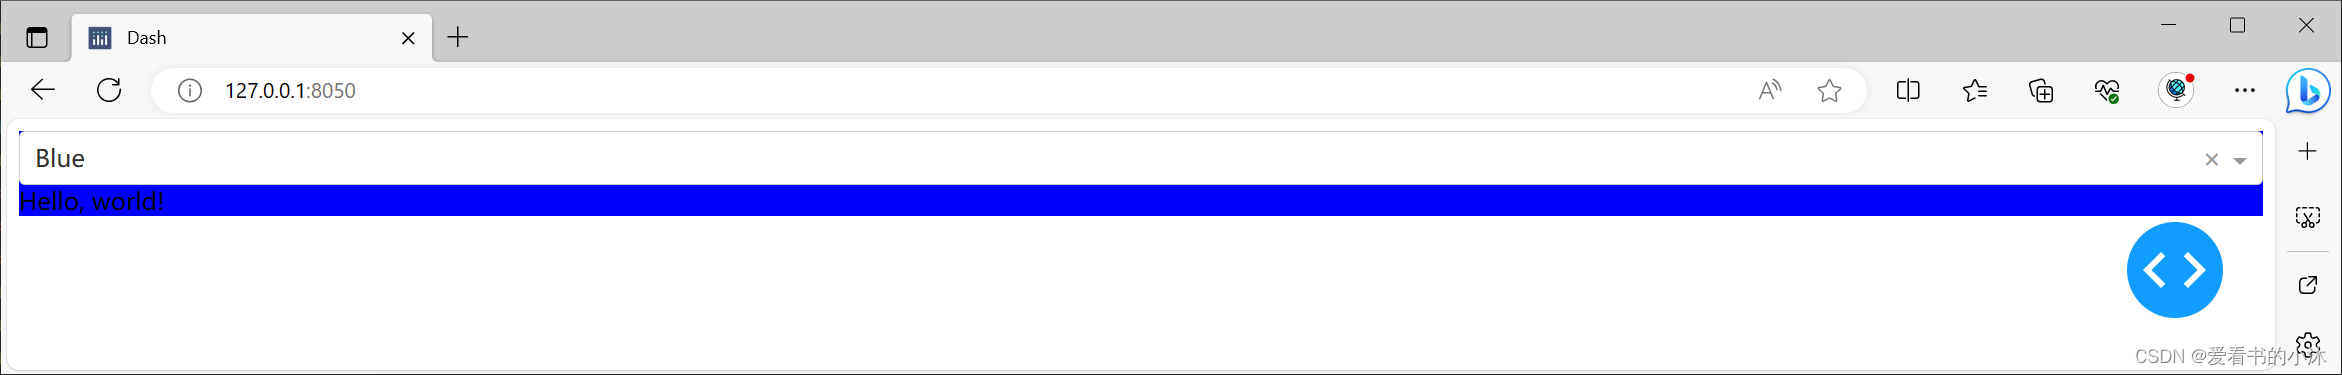
4.7 核心组件
from dash import dcc, html, Dash
from dash.dependencies import Input, Output

app = Dash(__name__)# 定义下拉选项
dropdown_options =[{'label':'Blue','value':'blue'},{'label':'Red','value':'red'},{'label':'Yellow','value':'yellow'},{'label':'Green','value':'green'}]# 定义app布局
app.layout = html.Div([
    dcc.Dropdown(options=dropdown_options,
                 value='blue',id='color-dropdown'),

    html.Div('Hello, world!',id='output-div', style={'padding':'20px'})], style={'backgroundColor':'blue'})# Set the initial background color# Define the app [email protected](Output('output-div','style'),[Input('color-dropdown','value')])defupdate_output_background_color(selected_color):if selected_color:# 更新div的背景色return{'backgroundColor': selected_color}if __name__ =='__main__':
    app.run_server(debug=True)
结语
如果您觉得该方法或代码有一点点用处,可以给作者点个赞,或打赏杯咖啡;
╮( ̄▽ ̄)╭
如果您感觉方法或代码不咋地
//(ㄒoㄒ)//
,就在评论处留言,作者继续改进;
o_O???
如果您需要相关功能的代码定制化开发,可以留言私信作者;
(✿◡‿◡)
感谢各位大佬童鞋们的支持!
( ´ ▽´ )ノ ( ´ ▽´)っ!!!
版权归原作者 爱看书的小沐 所有, 如有侵权,请联系我们删除。