
流程介绍:
- ilogtail日志采集写入kafka指定Topic
- Logstash 消费 kafak 消息 写入 ES
- Kibana 展示数据
注:
ilogtail采集的日志也能直接写入ES,需求 ES 版本 8.0 +
一、ilogtail介绍
简介
iLogtail 为可观测场景而生,拥有的轻量级、高性能、自动化配置等诸多生产级别特性,在阿里巴巴以及外部数万家阿里云客户内部广泛应用。你可以将它部署于物理机,虚拟机,Kubernetes 等多种环境中来采集遥测数据,例如logs、traces 和 metrics。
产品优势
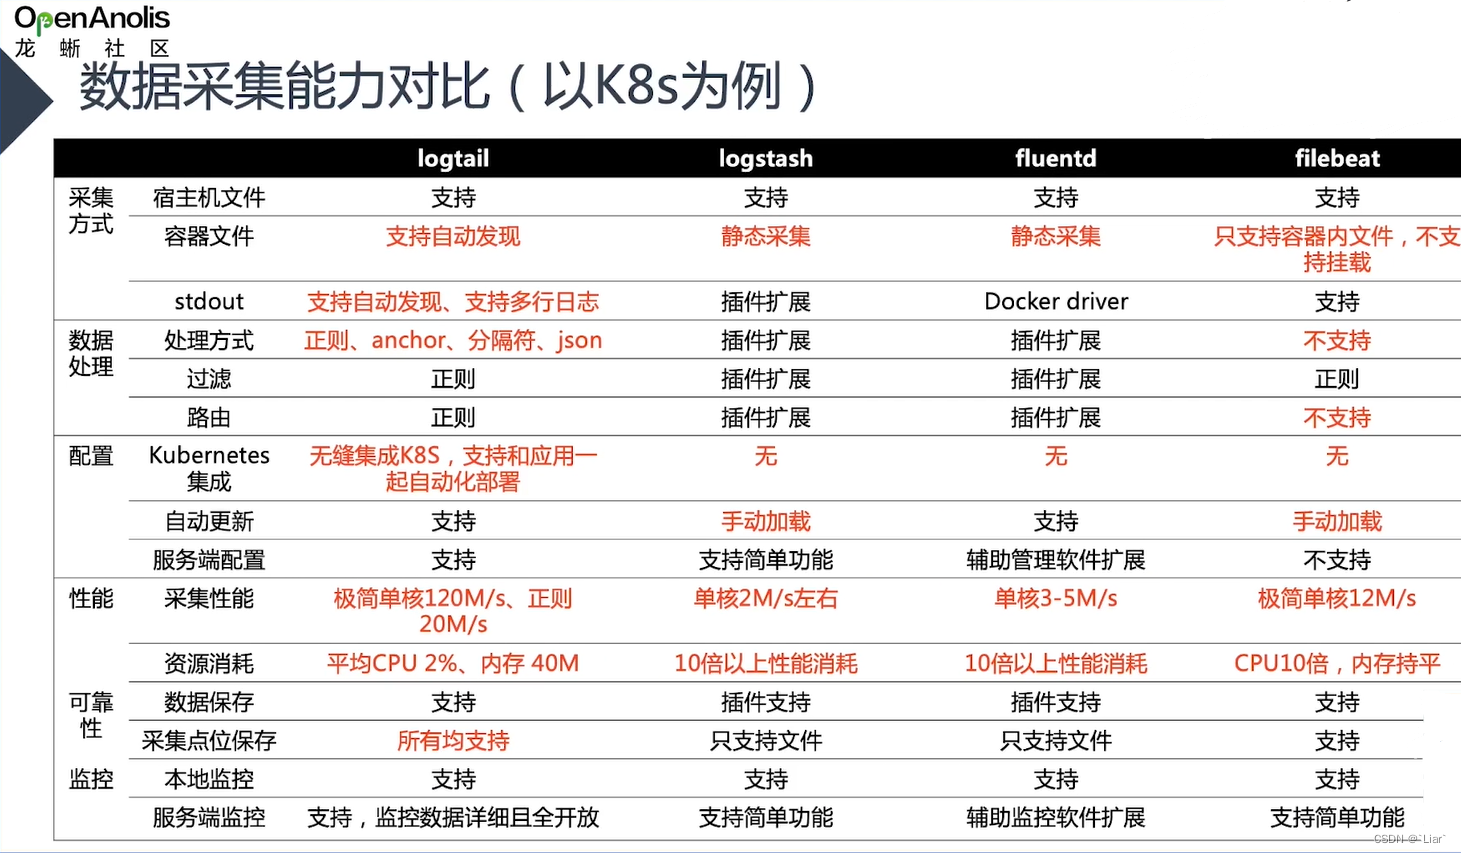
对于可观测数据的采集,有很多开源的采集器,例如 Logstash、Fluentd、Filebeats 等。这些采集器的功能非常丰富,但在性能、稳定性、管控能力等关键特性方面 iLogtail 因其独特设计而具备优势。
ilogtail 分社区版和商业版,本文采用开源社区版本 Kubernetes DaemonSet部署方式
ilogtail部署
使用前提
● 已部署 Kubernetes 集群
● 具备访问 Kubernetes 集群的 kubectl
二、logstash部署
ilogtail-daemonset.yaml
---
apiVersion: v1
kind: Namespace
metadata:
  name: ilogtail
---
apiVersion: apps/v1
kind: DaemonSet
metadata:
  name: ilogtail-ds
  namespace: ilogtail
  labels:
    k8s-app: logtail-ds
spec:
  selector:
    matchLabels:
      k8s-app: logtail-ds
  template:
    metadata:
      labels:
        k8s-app: logtail-ds
    spec:
      containers:
        - name: logtail
          env:
            - name: ALIYUN_LOG_ENV_TAGS # add log tags from env
              value: _node_name_|_node_ip_
            - name: _node_name_
              valueFrom:
                fieldRef:
                  apiVersion: v1
                  fieldPath: spec.nodeName
            - name: _node_ip_
              valueFrom:
                fieldRef:
                  apiVersion: v1
                  fieldPath: status.hostIP
            - name: cpu_usage_limit
              value: "1"
            - name: mem_usage_limit
              value: "512"
          image: >-
            sls-opensource-registry.cn-shanghai.cr.aliyuncs.com/ilogtail-community-edition/ilogtail:latest
          imagePullPolicy: IfNotPresent
          resources:
            limits:
              cpu: 1000m
              memory: 1Gi
            requests:
              cpu: 400m
              memory: 400Mi
          volumeMounts:
            - mountPath: /var/run
              name: run
            - mountPath: /logtail_host
              mountPropagation: HostToContainer
              name: root
              readOnly: true
            - mountPath: /usr/local/ilogtail/checkpoint
              name: checkpoint
            - mountPath: /usr/local/ilogtail/user_yaml_config.d
              name: user-config
              readOnly: true
      dnsPolicy: ClusterFirstWithHostNet
      hostNetwork: true
      volumes:
        - hostPath:
            path: /var/run
            type: Directory
          name: run
        - hostPath:
            path: /
            type: Directory
          name: root
        - hostPath:
            path: /var/lib/ilogtail-ilogtail-ds/checkpoint
            type: DirectoryOrCreate
          name: checkpoint
        - hostPath:
            path: /webtv/ilogtail-ilogtail-ds/user_yaml_config.d
            type: DirectoryOrCreate
          name: user-config
注:
- 当前iLogtail社区版暂时不支持配置热加载,因此这里我们先创建配置,后启动iLogtail容器。若后续需要更改,可以修改configmap后,重启ilogtail的pod/container使其生效
- ConfigMap期望以文件夹的方式挂载到iLogtail容器中作为采集配置目录,因此可以包含多个iLogtail采集配置文件
- 设置了节点的容忍性:不在master节点部署
- 若需要采集的日志文件数量很多,则需要适当地放宽资源限制/var/run:iLogtail与容器运行时通信的socket /logtail_host:iLogtail通过挂载主机目录获取节点上所有容器的日志 /usr/local/ilogtail/checkpoint:将状态持久化到主机磁盘,iLogtail容器重启不丢失 /usr/local/ilogtail/user_yaml_config.d:将configmap中的配置挂载到容器中
将采集文件存放至主机/webtv/ilogtail-ilogtail-ds/user_yaml_config.d下,可在以上yaml文件中自定义映射主机目录,业务需求采集以下目录/var/log/nginx/access.log,/var/log/nginx/error.log,/var/log/nginx/access.log,/usr/local/tomcat/logs/cronlog/access.log,/usr/local/tomcat/logs/cronlog/.log,/mcloud/*.log
采集文件如下:
nginx_access.yaml
enable: true
inputs:
  # 采集文件日志
  - Type: file_log
    LogPath: /var/log/nginx/
    FilePattern: "*access.log"
    MaxDepth: 0
    # 是否为容器日志
    ContainerFile: true
processors:
  - Type: processor_json
    SourceKey: content
    # 保留原始字段
    KeepSource: false
    # JSON展开的深度
    ExpandDepth: 4
    # 展开时的连接符
    ExpandConnector: "_"
    # 是否将原始字段名作为前缀
    #UseSourceKeyAsPrefix: true
  - Type: processor_grok
    SourceKey: content
    KeepSource: false
    # 匹配的Grok表达式数组
    Match:
      - '\[(?<time_local>.*?)\] \[(?<remote_addr>[\d\.]+)\] \"\[(?<http_x_forwarded_for>.*?)\]\" \"\[(?<request>\w+ [^\\"]*)\]\" \"\[(?<request_time>[\d\.]+)\]\"\[(?<status>\d+)\] \[(?<host_request_uri>.*?)\]'
      - '(?<remote_addr>[\d\.]+) - - \[(?<time_local>\S+ \S+)\] \"(?<request>\w+ [^\\"]*)\" (?<status>[\d\.]+) (?<body_bytes_sent>\d+) \"(?<http_referer>.*?)\" \"(?<http_user_agent>.*?)\" \"(?<http_x_forwarded_for>.*?)\"'
    # false:解析失败时丢弃日志
    IgnoreParseFailure: true
# 采集日志发送到kafka
flushers:
  - Type: flusher_kafka_v2
    Brokers:
      - 192.168.6.242:9092
    Topic: nginx-access-logs
nginx_err.yaml
enable: true
inputs:
  # 采集文件日志
  - Type: file_log
    LogPath: /var/log/nginx/
    FilePattern: "error.log"
    MaxDepth: 0
    # 是否为容器日志
    ContainerFile: true
processors:
  - Type: processor_split_log_regex
    SplitRegex: .*\d+:\d+:\d+.*
    SplitKey: content
    PreserveOthers: true
  - Type: processor_grok
    SourceKey: content
    KeepSource: false
    Match:
      - '(?<datetime>\d+/\d+/\d+ \d+:\d+:\d+) \[(?<log_level>\w+)\] (?<pid>\d+)#\d+: \*(?<number>\d+) (?<error_message>[\w\W]*?), client: (?<clientip>[\d\.]+), server: (?<server>.*?), request: \"(?<request>.*?)\", host: \"(?<host>.*?)\"'
    IgnoreParseFailure: true
# 采集日志发送到kafka
flushers:
  - Type: flusher_kafka_v2
    Brokers:
      - 192.168.6.242:9092
    Topic: nginx-error-logs
nginx_logs.yaml
enable: true
inputs:
  # 采集文件日志
  - Type: file_log
    LogPath: /var/log/nginx/access/
    FilePattern: "*.log"
    MaxDepth: 0
    # 是否为容器日志
    ContainerFile: true
processors:
  - Type: processor_json
    SourceKey: content
    # 保留原始字段
    KeepSource: false
    # JSON展开的深度
    ExpandDepth: 3
    # 展开时的连接符
    ExpandConnector: "_"
    # 是否将原始字段名作为前缀
    #UseSourceKeyAsPrefix: true
  - Type: processor_grok
    SourceKey: content
    KeepSource: false
    # 匹配的Grok表达式数组
    Match:
      - '\[(?<time_local>.*?)\] \[(?<remote_addr>[\d\.]+)\] \"\[(?<http_x_forwarded_for>.*?)\]\" \"\[(?<request>\w+ [^\\"]*)\]\" \"\[(?<request_time>[\d\.]+)\]\"\[(?<status>\d+)\] \[(?<host_request_uri>.*?)\]'
      - '(?<remote_addr>[\d\.]+) - - \[(?<time_local>\S+ \S+)\] \"(?<request>\w+ [^\\"]*)\" (?<status>[\d\.]+) (?<body_bytes_sent>\d+) \"(?<http_referer>.*?)\" \"(?<http_user_agent>.*?)\" \"(?<http_x_forwarded_for>.*?)\"'
    # false:解析失败时丢弃日志
    IgnoreParseFailure: true
# 采集日志发送到kafka
flushers:
  - Type: flusher_kafka_v2
    Brokers:
      - 192.168.6.242:9092
    Topic: nginx-access-logs
tomcat_access.yaml
enable: true
# 输入配置
inputs:
  # 采集文件日志
  - Type: file_log
    LogPath: /usr/local/tomcat/logs/cronlog/
    FilePattern: "access*.log"
    MaxDepth: 0
    # 是否为容器日志
    ContainerFile: true
processors:
  - Type: processor_json
    SourceKey: content
    # 保留原始字段
    KeepSource: false
    # JSON展开的深度
    ExpandDepth: 3
    # 展开时的连接符
    ExpandConnector: "_"
    # 是否将原始字段名作为前缀
    #UseSourceKeyAsPrefix: true
# 采集日志发送到kafka
flushers:
  - Type: flusher_kafka_v2
    Brokers:
      - 192.168.6.242:9092
    Topic: tomcat-access-logs
tomcat_catalina.yaml
enable: true
# 输入配置
inputs:
  # 采集文件日志
  - Type: file_log
    LogPath: /usr/local/tomcat/logs/
    FilePattern: "catalina*.log"
    MaxDepth: 0
    # 是否为容器日志
    ContainerFile: true
processors:
  - Type: processor_split_log_regex
    SplitRegex: .*\d+:\d+:\d+.*
    SplitKey: content
    PreserveOthers: true
# 采集日志发送到kafka
flushers:
  - Type: flusher_kafka_v2
    Brokers:
      - 192.168.6.242:9092
    Topic: tomcat-app-logs
tomcat_cronlog.yaml
enable: true
# 输入配置
inputs:
  # 采集文件日志
  - Type: file_log
    LogPath: /usr/local/tomcat/logs/cronlog/
    FilePattern: "*.log"
    MaxDepth: 0
    # 是否为容器日志
    ContainerFile: true
processors:
  - Type: processor_split_log_regex
    SplitRegex: .*\d+:\d+:\d+.*
    SplitKey: content
    PreserveOthers: true
  - Type: processor_desensitize
    SourceKey: content
    Method: "const"
    Match: "regex"
    ReplaceString: "********"
    RegexBegin: "(密钥:|密钥为|加密后:)"
    RegexContent: "[^'|^\"]*"
# 采集日志发送到kafka
flushers:
  - Type: flusher_kafka_v2
    Brokers:
      - 192.168.6.242:9092
    Topic: tomcat-cronlog-logs
container_logs.yaml
enable: true
inputs:
  # 采集文件日志
  - Type: file_log
    LogPath: /mcloud/
    FilePattern: "*.log"
    # 采集目录深度
    MaxDepth: 5
    # 是否为容器日志
    ContainerFile: true
processors:
  - Type: processor_split_log_regex
    SplitRegex: .*\d+:\d+:\d+.*
    SplitKey: content
    PreserveOthers: true
  - Type: processor_desensitize
    SourceKey: content
    Method: "const"
    Match: "regex"
    ReplaceString: "********"
    RegexBegin: "PASSWORD' => '"
    RegexContent: "[^'|^\"]*"
  - Type: processor_desensitize
    SourceKey: content
    Method: "const"
    Match: "regex"
    ReplaceString: "********"
    RegexBegin: "(password|PASSWORD). => "
    RegexContent: "[^'|^\"]*"
  - Type: processor_desensitize
    SourceKey: content
    Method: "const"
    Match: "regex"
    ReplaceString: "********"
    RegexBegin: "'password':'|\"password\":\""
    RegexContent: "[^'|^\"]*"
  - Type: processor_desensitize
    SourceKey: content
    Method: "const"
    Match: "regex"
    ReplaceString: "********"
    RegexBegin: "AccessKeyId: ['|\"]|AccessKeySecret: ['|\"]"
    RegexContent: "[^'|^\"]*"
  - Type: processor_json
    SourceKey: content
    # 保留原始字段
    KeepSource: false
    # JSON展开的深度
    ExpandDepth: 3
    # 展开时的连接符
    ExpandConnector: "_"
    # 是否将原始字段名作为前缀
    #UseSourceKeyAsPrefix: true
# 采集日志发送到kafka
flushers:
  - Type: flusher_kafka_v2
    Brokers:
      - 192.168.6.242:9092
    Topic: prod-csp-logs
container_stdout.yaml
enable: true
inputs:
  - Type: service_docker_stdout
    Stderr: true
    Stdout: true
    BeginLineRegex: ".*\\d+:\\d+:\\d+.*"
# 采集日志发送到kafka
flushers:
  - Type: flusher_kafka_v2
    Brokers:
      - 192.168.6.242:9092
    Topic: container-stdout-logs
以上采集日志均推送到了192.168.6.242:9092,
三、部署kafka
安装java环境
官网:(Java Archive Downloads - Java SE 8u211 and later)
以下载jdk-8u391-linux-x64.tar.gz为例,并上传至服务器
mkdir -p /usr/local/java
tar xf jdk-8u391-linux-x64.tar.gz -C /usr/local/java/

#在/etc/profile中添加以下内容
export JAVA_HOME=/usr/local/java/jdk1.8.0_391
export JRE_HOME=${JAVA_HOME}/jre
export CLASSPATH=.:${JAVA_HOME}/lib:${JRE_HOME}/lib
export PATH=${JAVA_HOME}/bin:$PATH

#立即生效
source /etc/profile
通过打印Java 版本验证 Java 安装校验:
java -version

下载Kafka版本
本文下载的是kafka_2.12-3.5.1.tgz版本,可以使用wget下载,也可以自行下载。 下载地址:http://kafka.apache.org/downloads
curl -LO https://downloads.apache.org/kafka/3.5.1/kafka_2.12-3.5.1.tgz
安装和配置
1、将包下载到相关的目录,然后解压Zookeeper到指定目录;
cd /opt/
tar xf kafka_2.12-3.5.1.tgz
2、修改kafka配置文件;(确保log.dirs目录存在)
vim config/server.properties

#修改以下两行
#kafka监听地址
listeners=PLAINTEXT://192.168.6.242:9092
#指定kafka存放日志路径
log.dirs=/elk/kafka-logs
3、修改zookeeper配置文件;(确保dataDir目录存在)
vim config/zookeeper.properties

dataDir=/elk/zookeeper
clientPort=2181
maxClientCnxns=0
admin.enableServer=false
4、启动zookeeper;
nohup ./bin/zookeeper-server-start.sh config/zookeeper.properties &
5、启动kafka;
nohup bin/kafka-server-start.sh config/server.properties &
启动ilogtail yaml文件
kubectl apply -f ilogtail-daemonset.yaml
- 检查pod 启动情况并去 kafka 验证日志
kubectl get pod -n ilogtail
#查看/elk/kafka-logs生成日志信息
cd /elk/kafka-logs
四、logstash部署
vim /etc/yum.repos.d/logstash.repo

[logstash-7.x]
name=Elastic repository for 7.x packages
baseurl=https://artifacts.elastic.co/packages/7.x/yum
gpgcheck=1
gpgkey=https://artifacts.elastic.co/GPG-KEY-elasticsearch
enabled=1
autorefresh=1
type=rpm-md
yum install -y logstash

cd /etc/logstash/conf.d
#将logstash采集文件放置/etc/logstash/conf.d目录
logstash-nginxaccess.conf
input {
  kafka {
    bootstrap_servers => ["192.168.6.242:9092"]
    client_id => "test5"
    group_id => "nginxaccesslogs"
    auto_offset_reset => "latest"
    consumer_threads => 5
    decorate_events => true
    topics => ["nginx-access-logs"]
    type => "nginxaccess"
  }
}

filter{
    if [message] =~ /\/health-check/ {
        drop {}
    }
    if [message] =~ /\/check-status/ {
        drop{}
    }
    if [message] =~ /\/nginx_status/ {
        drop{}
    }
    if [message] =~ /\/checkstatus/ {
        drop{}
    }
    json {
        # 将message作为解析json的字段
        source => "message"
        remove_field => ["message"]
    }
}

output {
    elasticsearch {
        hosts => ["http://192.168.6.242:9200","http://192.168.6.170:9200","http://192.168.7.167:9200"]
        index => "nginx-access-logs"
    }
}
logstash-nginxerr.conf
input {
  kafka {
    bootstrap_servers => ["192.168.6.242:9092"]
    client_id => "test6"
    group_id => "nginxerrorlogs"
    auto_offset_reset => "latest"
    consumer_threads => 5
    decorate_events => true
    topics => ["nginx-error-logs"]
    type => "nginxerror"
  }
}

filter{
    if [message] =~ /\/status/ {
        drop {}
    }
    if [message] =~ /\/nginx_status/ {
        drop {}
    }
    if [message] =~ /\/check-status/ {
        drop {}
    }
    if [message] =~ /check-health/ {
        drop {}
    }
    json {
        # 将message作为解析json的字段
        source => "message"
        remove_field => ['message']
    }

}

output {
    elasticsearch {
        hosts => ["http://192.168.6.242:9200","http://192.168.6.170:9200","http://192.168.7.167:9200"]
        index => "nginx-error-logs"
    }
}
logstash-tomcataccess.conf
input {
  kafka {
    bootstrap_servers => ["192.168.6.242:9092"]
    client_id => "test7"
    group_id => "tomcataccesslogs"
    auto_offset_reset => "latest"
    consumer_threads => 5
    decorate_events => true
    topics => ["tomcat-access-logs"]
    type => "tomcat"
  }
}

filter{
    if [message] =~ /\/Healthcheck/ {
        drop {}
    }
    if [message] =~ /\/healthcheck/ {
        drop {}
    }
    if [message] =~ /\/healthCheck/ {
        drop {}
    }
    if [message] =~ /check-health/ {
        drop {}
    }
    json {
        # 将message作为解析json的字段
        source => "message"
        remove_field => ['message']
        remove_field => ['fields']
    }
}

output {
    elasticsearch {
        hosts => ["http://192.168.6.242:9200","http://192.168.6.170:9200","http://192.168.7.167:9200"]
        index => "tomcat-access-logs"
    }
}
logstash-tomcatcronlog.conf
input {
  kafka {
    bootstrap_servers => ["192.168.6.242:9092"]
    client_id => "test8"
    group_id => "tomcatcronlogs"
    auto_offset_reset => "latest"
    consumer_threads => 5
    decorate_events => true
    topics => ["tomcat-cronlog-logs"]
    type => "tomcat"
  }
}

filter{
    if [message] =~ /\/Healthcheck/ {
        drop {}
    }
    if [message] =~ /\/healthcheck/ {
        drop {}
    }
    if [message] =~ /\/healthCheck/ {
        drop {}
    }
    if [message] =~ /check-health/ {
        drop {}
    }
    json {
        # 将message作为解析json的字段
        source => "message"
        remove_field => ['message']
        remove_field => ['fields']
    }
}

output {
    elasticsearch {
        hosts => ["http://192.168.6.242:9200","http://192.168.6.170:9200","http://192.168.7.167:9200"]
        index => "tomcat-cronlog-logs"
    }
}
启动logstash
systemctl start logstash
logstash日志目录/var/log/logstash/
五、es集群部署
rpm --import https://artifacts.elastic.co/GPG-KEY-elasticsearch
tee /etc/yum.repos.d/elasticsearch.repo <<-'EOF'
[elasticsearch-7.x]
name=Elasticsearch repository for 7.x packages
baseurl=https://artifacts.elastic.co/packages/7.x/yum
gpgcheck=1
gpgkey=https://artifacts.elastic.co/GPG-KEY-elasticsearch
enabled=1
autorefresh=1
type=rpm-md
EOF
使用YUM源进行安装
yum install -y elasticsearch-7.17.6
修改配置文件:(/etc/elasticsearch/elasticsearch.yml)
#集群名称,三台节点必须一样
cluster.name: elasticsearch
#节点名称,三台节点必须都不一样
node.name: master
#是否有资格被选举为主节点
node.master: true
#是否存储索引数据
node.data: true
#数据存储位置
path.data: /elk/elasticsearch
#日志存储位置
path.logs: /var/log/elasticsearch
#设置绑定的ip,也是与其他节点交互的ip
network.host: 192.168.6.242
#http访问端口
http.port: 9200
#节点之间交互的端口号
transport.tcp.port: 9300
#是否支持跨域
http.cors.enabled: true
#当设置允许跨域,默认为*,表示支持所有域名
http.cors.allow-origin: "*"
#集群中master节点的初始列表
discovery.zen.ping.unicast.hosts: ["192.168.6.242:9300","192.168.6.170:9300","192.168.7.167:9300"]
#设置几台符合主节点条件的节点为主节点以初始化集群(低版本不适用此配置项,es默认会把第一个加入集群的服务器设置为master)
cluster.initial_master_nodes: ["master"]
discovery.zen.minimum_master_nodes: 2       # 为了避免脑裂,集群节点数最少为 半数+1
将/etc/elasticsearch/elasticsearch.yml拷贝至另外两台节点,并修改node.name、network.host、discovery.zen.ping.unicast.hosts参数,path.data及path.logs可自定义数据和日志存储位置
安装IK分词器插件
由于elastic官方未提供ik分词插件,需下载插件进行安装。(适配es7.17.6版本)
链接:https://pan.baidu.com/s/1_RGAzctJk17yJjHOb4OEJw?pwd=to96
提取码:to96
/usr/share/elasticsearch/bin/elasticsearch-plugin install file:///root/elasticsearch-analysis-ik-7.17.6.zip
将elasticsearch加入开机自启动,并立即启动。
systemctl enable elasticsearch.service --now
六、kibana部署
下载地址:Download Kibana Free | Get Started Now | Elastic
#解压kibana软件包,可使用-C自定义解压路径
tar xf kibana-7.17.6-linux-x86_64.tar.gz
cd kibana-7.17.6-linux-x86_64/config
vim kibana.yml
# Kibana 访问地址
server.host: 0.0.0.0
# elasticsearch集群列表
elasticsearch.hosts: ["http://***:9200","http://***:9200","http://***:9200"]
#后台启动
nohup ./bin/kibana --allow-root &
版权归原作者 `Liar` 所有, 如有侵权,请联系我们删除。