
引言
因为很多文档都是英文,刚开始调研的时候比较费劲,文档里的配置像示例又比较分散,就自己整理了一下,附上测试时写的示例
d3是什么?
d3.js
是一个强大的JavaScript库,用于在Web上生成动态、交互式的数据可视化。并且提供了大量用于处理数据和创建图形的函数和方法。这些函数和方法可以组合在一起,以创建从简单的条形图到复杂的网络图等各种类型的可视化。
官网文档:
D3 by Observable | The JavaScript library for bespoke data visualizationThe JavaScript library for bespoke data visualizationhttps://d3js.org/
dagre是什么?
Dagre是一个JavaScript库,主要用于创建有向图(Directed Graph)。可以为你的应用或网站创建美观、易读的图表,特别适合于数据可视化、流程图和状态机等场景。
Dagre提供了一套简单的API,允许开发者将节点和边的数据结构转换为具有良好视觉效果的图形布局。其核心算法优化了节点和边的排列方式,使得整个图看起来更加清晰且有逻辑性。此外,Dagre还能兼容各种图形渲染库,如d3.js和svg.js,进一步增强了其灵活性。
dagre-d3是什么?
Dagre-D3是基于d3的dagre渲染器,是dagre的前端子库,底层使用D3进行渲染。Dagre-D3提供了一些渲染选项,使得使用Dagre创建的图形能够以更美观和交互性的方式呈现。
官网文档:
https://github.com/dagrejs/dagre-d3/wikihttps://github.com/dagrejs/dagre-d3/wiki
dagre-d3配置项
创建对象graph
const g = new dagreD3.graphlib.Graph().setGraph({});
//TB(从上到下)、BT(从下到上)、LR(从左到右)、RL(从右到左)
g.graph().rankdir = "LR";
绘制节点setNode(节点元素(唯一),{节点元素的配置项})
g.setNode(A, {
    //节点元素的形状rect(长方形)、circle(圆)、diamond(菱形)、ellipse(椭圆)

    shape: "rect",//默认,还可以自定义详细找官网

    label: "one",  //节点元素的内容

    style: "fill: #afa",  //节点元素的背景颜色

    labelStyle: "font-weight: bold",  //节点元素的内容样式

    class: “className”

    rx: 5,  //圆角

    ry: 5
});
绘制连接
g.setEdge(节点元素1, 节点元素2, {连接线配置项});
g.setEdge("one", "two", {
    //连接箭头样式normal(实心三角), vee(箭头), undirected(无)

    arrowhead: "normal",//还可以自定义详细找官网

    label:"one-two"//连接线提示内容

    labelStyle:""//连接线提示内容样式

    style: "fill: #afa",  //连接线样式

    arrowheadStyle: "fill: #f66"//箭头样式

    arrowheadClass: ""
});
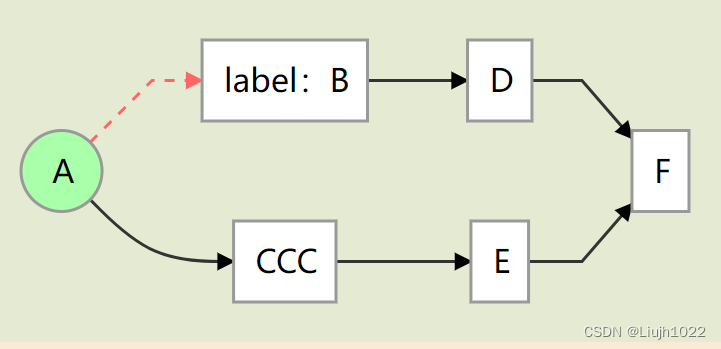
流程图示例
依赖安装
d3
npm install d3
yarn add d3
dagre-d3
npm install dagre-d3
yarn add dagre-d3
组件示例
<script setup>
import * as d3 from "d3";
import dagreD3 from "dagre-d3";
import { onMounted } from "vue";
const digraphdHandle = () => {
  const g = new dagreD3.graphlib.Graph().setGraph({});
  g.setDefaultEdgeLabel(function () {
    return {};
  });
  //方向
  g.graph().rankdir = "LR";
  //绘制节点
  g.setNode("A", {
    shape: "circle",
    label: "A",
    style: "fill: #afa",
  });
  g.setNode("B", { label: "label:B" });
  g.setNode("C", { label: "CCC" });
  g.setNode("D", { label: "D" });
  g.setNode("E", { label: "E" });
  g.setNode("F", { label: "F" });
  //绘制连接线
  g.setEdge("A", "B", {
    arrowhead: "vee",
    arrowheadStyle: "fill: #f66",
    style: "stroke: #f66;stroke-width: 1.5px;stroke-dasharray: 5, 5;",
  });
  g.setEdge("A", "C", {
    arrowhead: "undirected",
    curve: d3.curveBasis,
  });
  g.setEdge("B", "D");
  g.setEdge("C", "E");
  g.setEdge("D", "F");
  g.setEdge("E", "F");
  const svg = d3.select("#graphSvg");
  const render = new dagreD3.render();
  // Center the graph
  const svgGroup = svg.append("g");
  render(d3.select("svg g"), g);
  svg.attr("width", g.graph().width + 40);
  svg.attr("height", g.graph().height + 40);
  svgGroup.attr("transform", "translate(20, 20)");
};
onMounted(() => {
  digraphdHandle();
});
</script>

<template>
  <div class="graph"><svg id="graphSvg" width="800" height="600"></svg></div>
</template>

<style>
.graph {
  background-color: antiquewhite;
}
#graphSvg {
  background-color: #e5ebd3;
}
.node rect {
  stroke: #999;
  fill: #fff;
  stroke-width: 1.5px;
}
.node circle {
  stroke: #999;
  /* fill: #fff; */
  stroke-width: 1.5px;
}

.edgePath path.path {
  stroke: #333;
  fill: none;
  stroke-width: 1.5px;
}
</style>
总结
前期调研使用到的一些配置项和测试示例,适用于没有接触过d3、dagre-d3的开发人员快速了解流程图开发,也方便自己日后使用。
版权归原作者 Liujh1022 所有, 如有侵权,请联系我们删除。