
文章目录
前言
ubuntu18.04 跑通OpenPCDet
OpenPCDet is a clear, simple, self-contained open source project for LiDAR-based 3D object detection.
最近正在学习3D目标检测的算法,OpenPCDet是由
香港中文大学MMLab
实验室开源的轻量话激光雷达点云目标检测框架,它定义了一种统一的3D坐标系以及采用了数据与模型分离的高层代码设计思想,使用起来非常方便。
但是在早期的版本中由于
spconv库
很难安装(有关spconv库的安装可以看我的博客:OpenPCDet完整环境下Spconv1.x与Spconv2.x的安装问题及解决方法),之后我将使用OpenPCDet完成pointpillars算法的训练、评估、可视化等操作。
一、安装OpenPCDet
1.OpenPCDet安装要求
图源自
https://github.com/open-mmlab/OpenPCDet/blob/master/docs/INSTALL.md
,也就是OpenPCDet的安装手册
2.安装环境
创建虚拟环境
conda create -n OpenPCDet python==3.7
激活环境
conda activate OpenPCDet
先单独安装torch,torch安装连接为:
https://pytorch.org/get-started/previous-versions/
安装选用的命令行为:
pip installtorch==1.10.0+cu111 torchvision==0.11.0+cu111 torchaudio==0.10.0 -f https://download.pytorch.org/whl/torch_stable.html
torch安装完成后,cd 到clone好的OpenPCDet目录下:
pip install-r requirements.txt
3.Clone OpenPCDet项目
git clone https://github.com/open-mmlab/OpenPCDet.git
4.运行以下的命令安装pcdet库
python setup.py develop
二、运行OpenPCDet
1.数据集准备
下载官方的KITTI数据集,官方的KITTI数据集下载链接如下:KITT数据集官方下载链接。下载好zip文件之后,需要将数据集放在OpenPCDet/data/kitti文件夹下面,新建
training、testing
文件夹,将
calib、velodyne、label_2、image_2
文件夹解压,并把他们放到对应的
training、testing
文件夹中,
testing
文件夹没有
label_2
文件。之后我们可以看到文件夹的组织结构如下:
OpenPCDet
├── data
│   ├── kitti
│   │   │── ImageSets
│   │   │── training
│   │   │   ├──calib & velodyne & label_2 & image_2 &(optional: planes)&(optional: depth_2)
│   │   │── testing
│   │   │   ├──calib & velodyne & image_2
├── pcdet
├── tools
在完成数据集的准备之后我们再对数据集进行处理,从而生成kitti_gt_database中的的 .bin 格式的文件和.pkl 格式文件,处理的命令如下:
python -m pcdet.datasets.kitti.kitti_dataset create_kitti_infos tools/cfgs/dataset_configs/kitti_dataset.yaml
2.训练
关键参数的解析:
1.
--cfg_file ${CONFIG_FILE}
指的是所使用的
config
文件,路径为:
/openpcdet/tools/cfgs/kitti_models/pointpillar.yaml
,此时表示对pointpillar进行训练。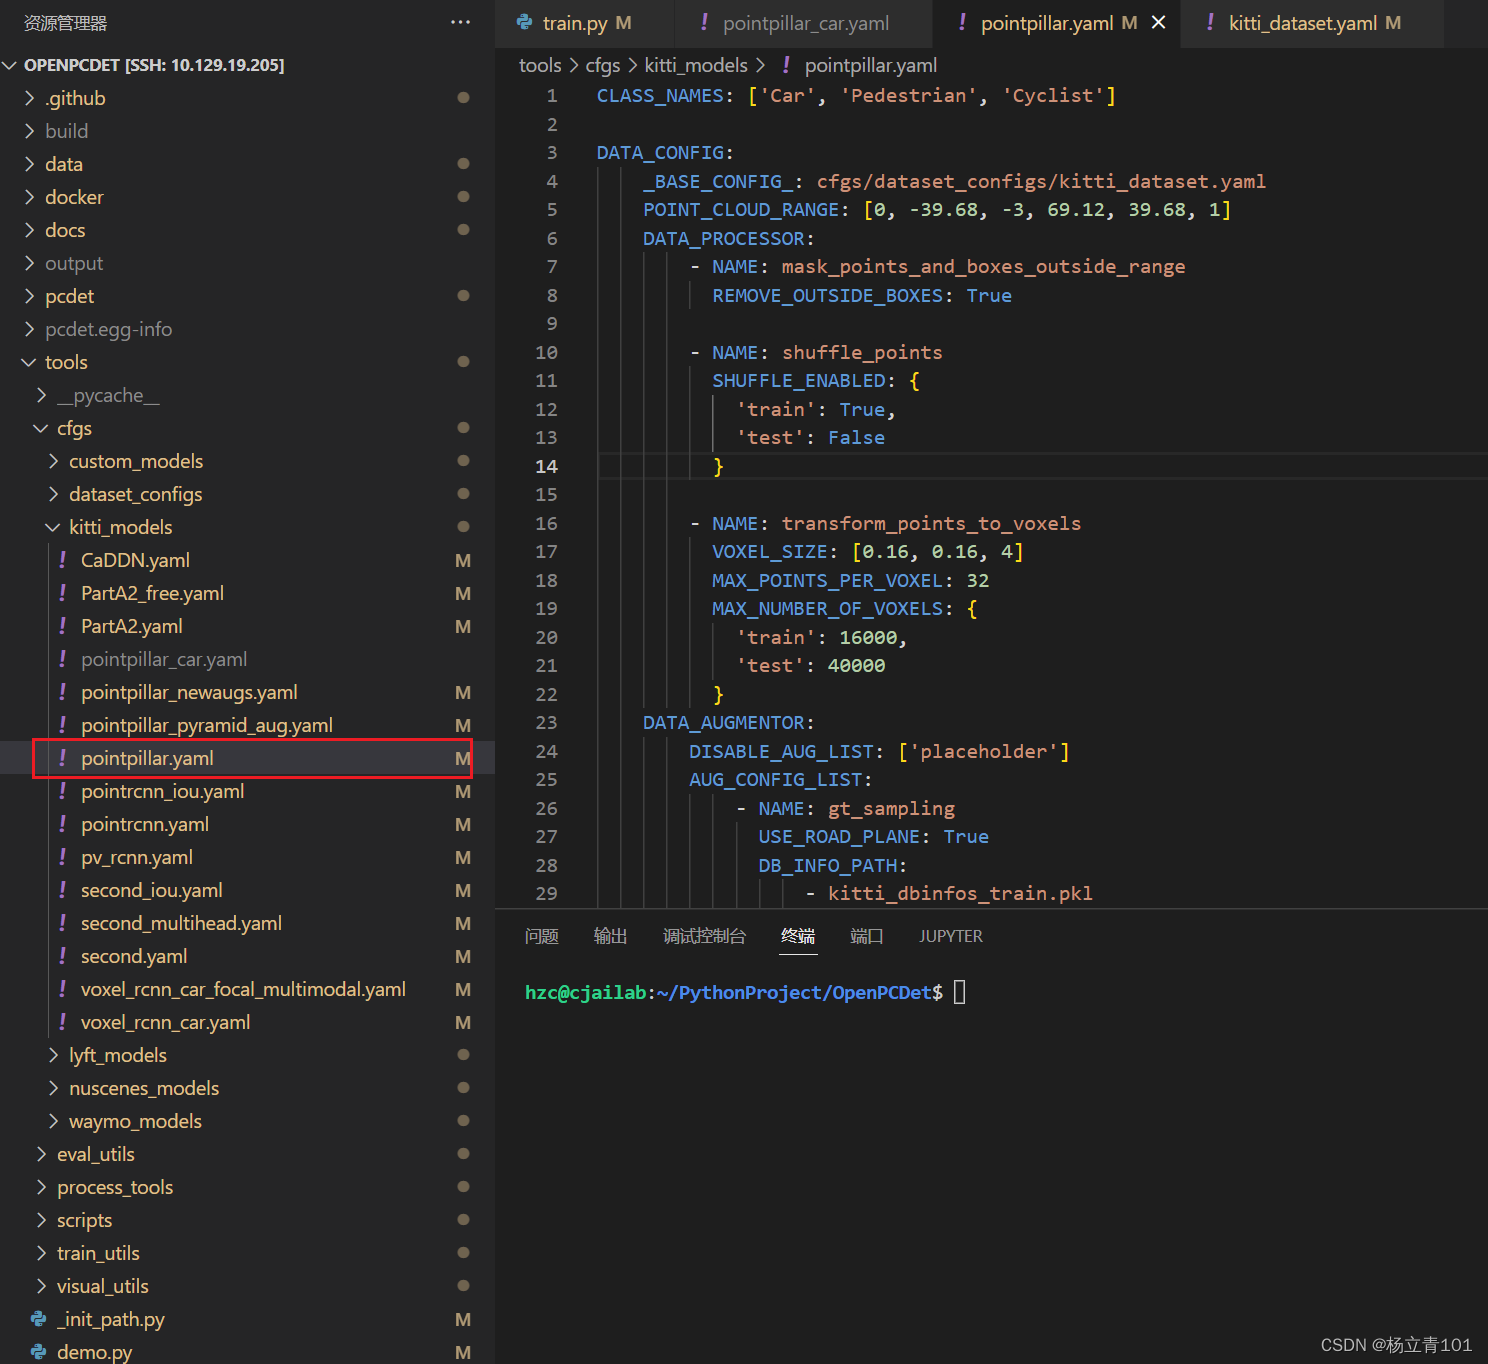
2.
Batch_size
、
epoch
的修改
对刚刚的
pointpillar.yaml
进行修改,如下的
BATCH_SIZE_PER_GPU
代表每块GPU的
Batch_size
数量,
NUM_EPOCHS
指的是训练的epoch总数量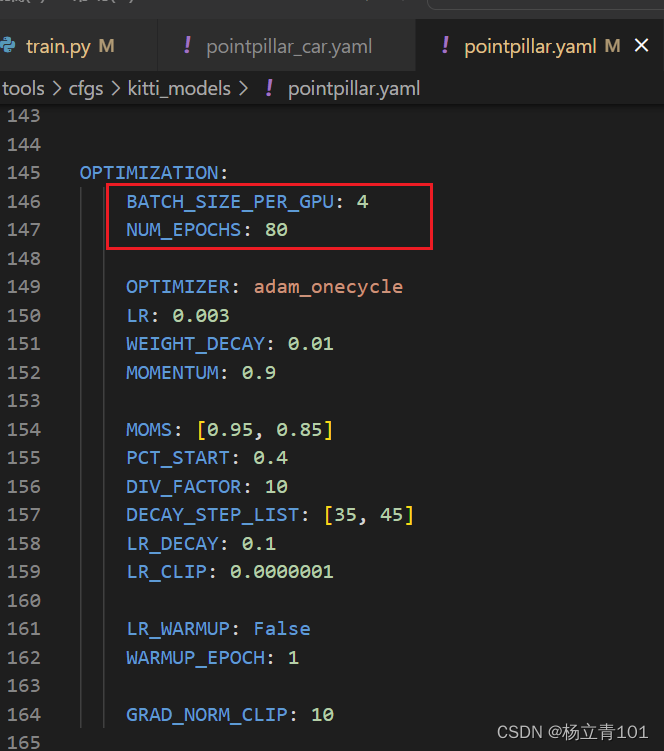
3.
output_dir
的地址
在训练时找到
train.py
的改行代码,修改这些参数即可更改对应的地址。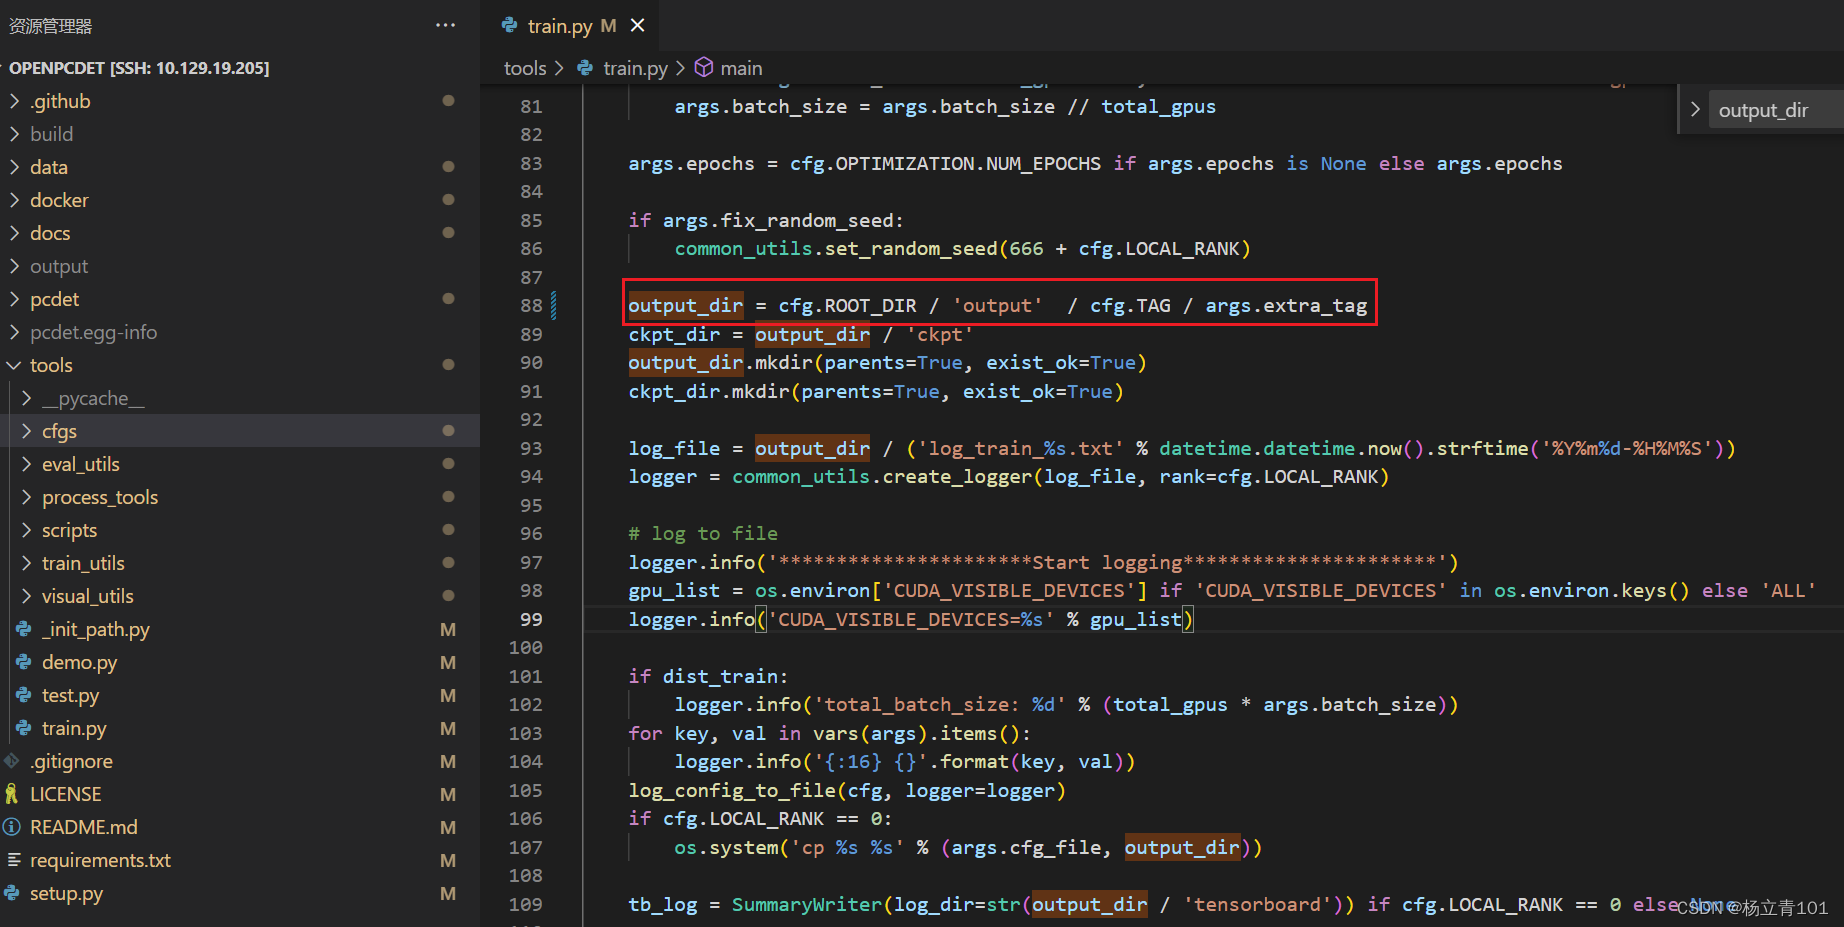
单卡训练
:
* Train with a single GPU:
shell script
python train.py --cfg_file ${CONFIG_FILE}
示例,进入到tools文件夹下:
python train.py --cfg_file cfgs/kitti_models/pointpillar.yaml
多卡训练
:
* Train with multiple GPUs or multiple machines
shell script
sh scripts/dist_train.sh ${NUM_GPUS}--cfg_file ${CONFIG_FILE}
示例,进入到tools文件夹下,${NUM_GPUS}代表的是GPU的数量,下方的“4”指的是用4卡运行GPU:
sh scripts/dist_train.sh 4--cfg_file cfgs/kitti_models/pointpillar.yaml
3.测试
Test and evaluate the pretrained models
- Test with a pretrained model:
```shell script
python test.py --cfg_file${CONFIG_FILE}--batch_size${BATCH_SIZE}--ckpt${CKPT}
- To test all the saved checkpoints of a specific training setting and draw the performance curve on the Tensorboard, add the
--eval_allargument:
python test.py --cfg_file${CONFIG_FILE}--batch_size${BATCH_SIZE}--eval_all
- To test with multiple GPUs:
sh scripts/dist_test.sh ${NUM_GPUS}\--cfg_file${CONFIG_FILE}--batch_size${BATCH_SIZE}
三、OpenPCDet的可视化
1.安装open3d
首先需要安装可视化的库,
mayavi
或者
open3d
两者都可以,但是安装mayavi的时候问题比较多,建议安装open3d。
pip install open3d==0.11
注意:这里建议安装
open3d
的
0.11
版本,否则后续可视化是会报错:
'NoneType' object has no attribute 'point_size'
2.测试open3d是否安装成功
python
import open3d
结果如下表示成功安装: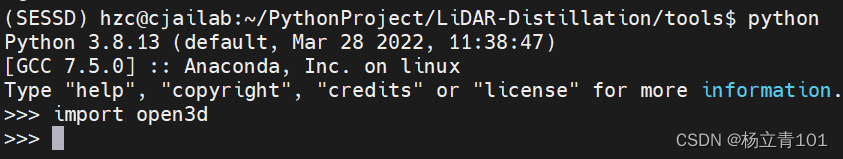
3.可视化测试
可视化代码:
python demo.py --cfg_file cfgs/kitti_models/pv_rcnn.yaml \--ckpt pv_rcnn_8369.pth \--data_path${POINT_CLOUD_DATA}
例子:
python demo.py --cfg_file /home/hzc/PythonProject/LiDAR-Distillation/tools/cfgs/kitti_models/pointpillar_car.yaml --ckpt /home/hzc/PythonProject/LiDAR-Distillation/output/pointpillar_car/default/ckpt/checkpoint_epoch_79.pth --data_path /data1_4t/dataset/KITTI/testing/velodyne/000211.bin
运行时发生报错:
I got a Error =[ GLFW Error: X11: The DISPLAY environment variable is missing ]
解决方法:
https://blog.csdn.net/WUDIxi/article/details/123577374
远程调试 qt.qpa.xcb: could not connect to display, echo DISPLAY为空[已解决]
上面的两个网页可以参考一下,遇到的是相同的问题,在这里我们需要借助远程ssh连接工具,比如使用
mobaxterm
,在
mobaxterm
的命令行输入
echo$DISPLAY
得到的输出为:
localhost:11.0
再打开vscode的终端设置DISPLAY的值为11.0,命令如下:
exportDISPLAY=11.0
运行结果: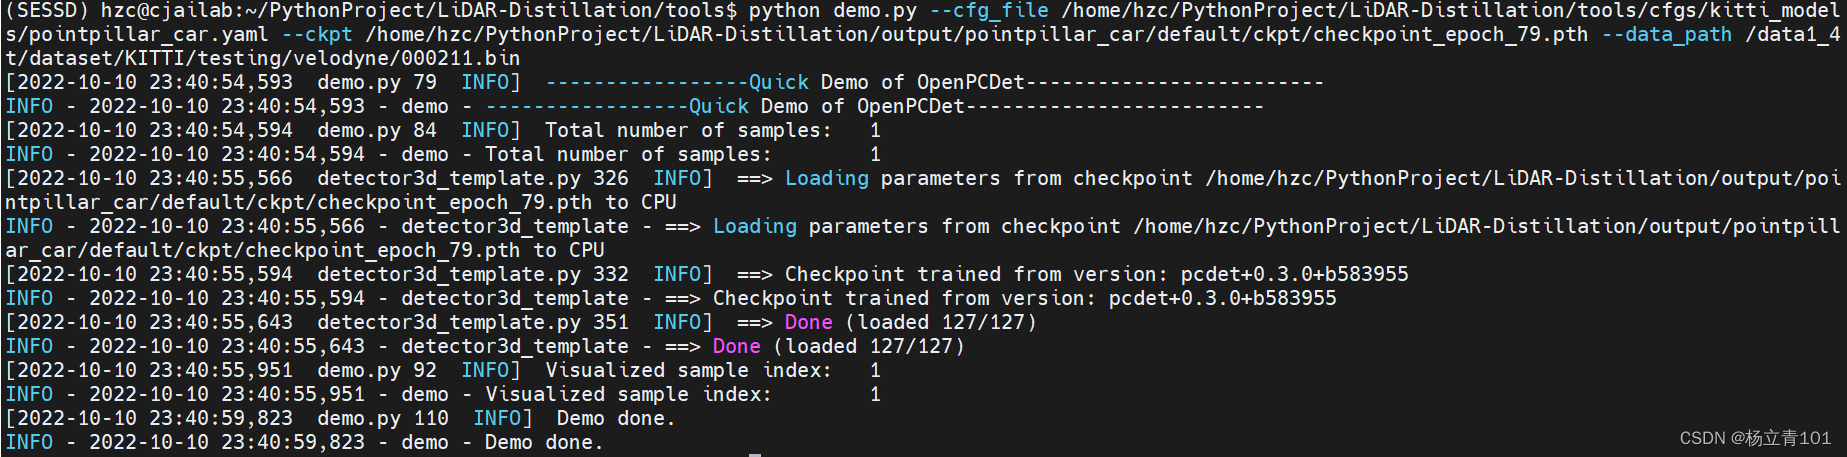 在vscode下重新输入可视化的命令,得到的可视化结果如下:
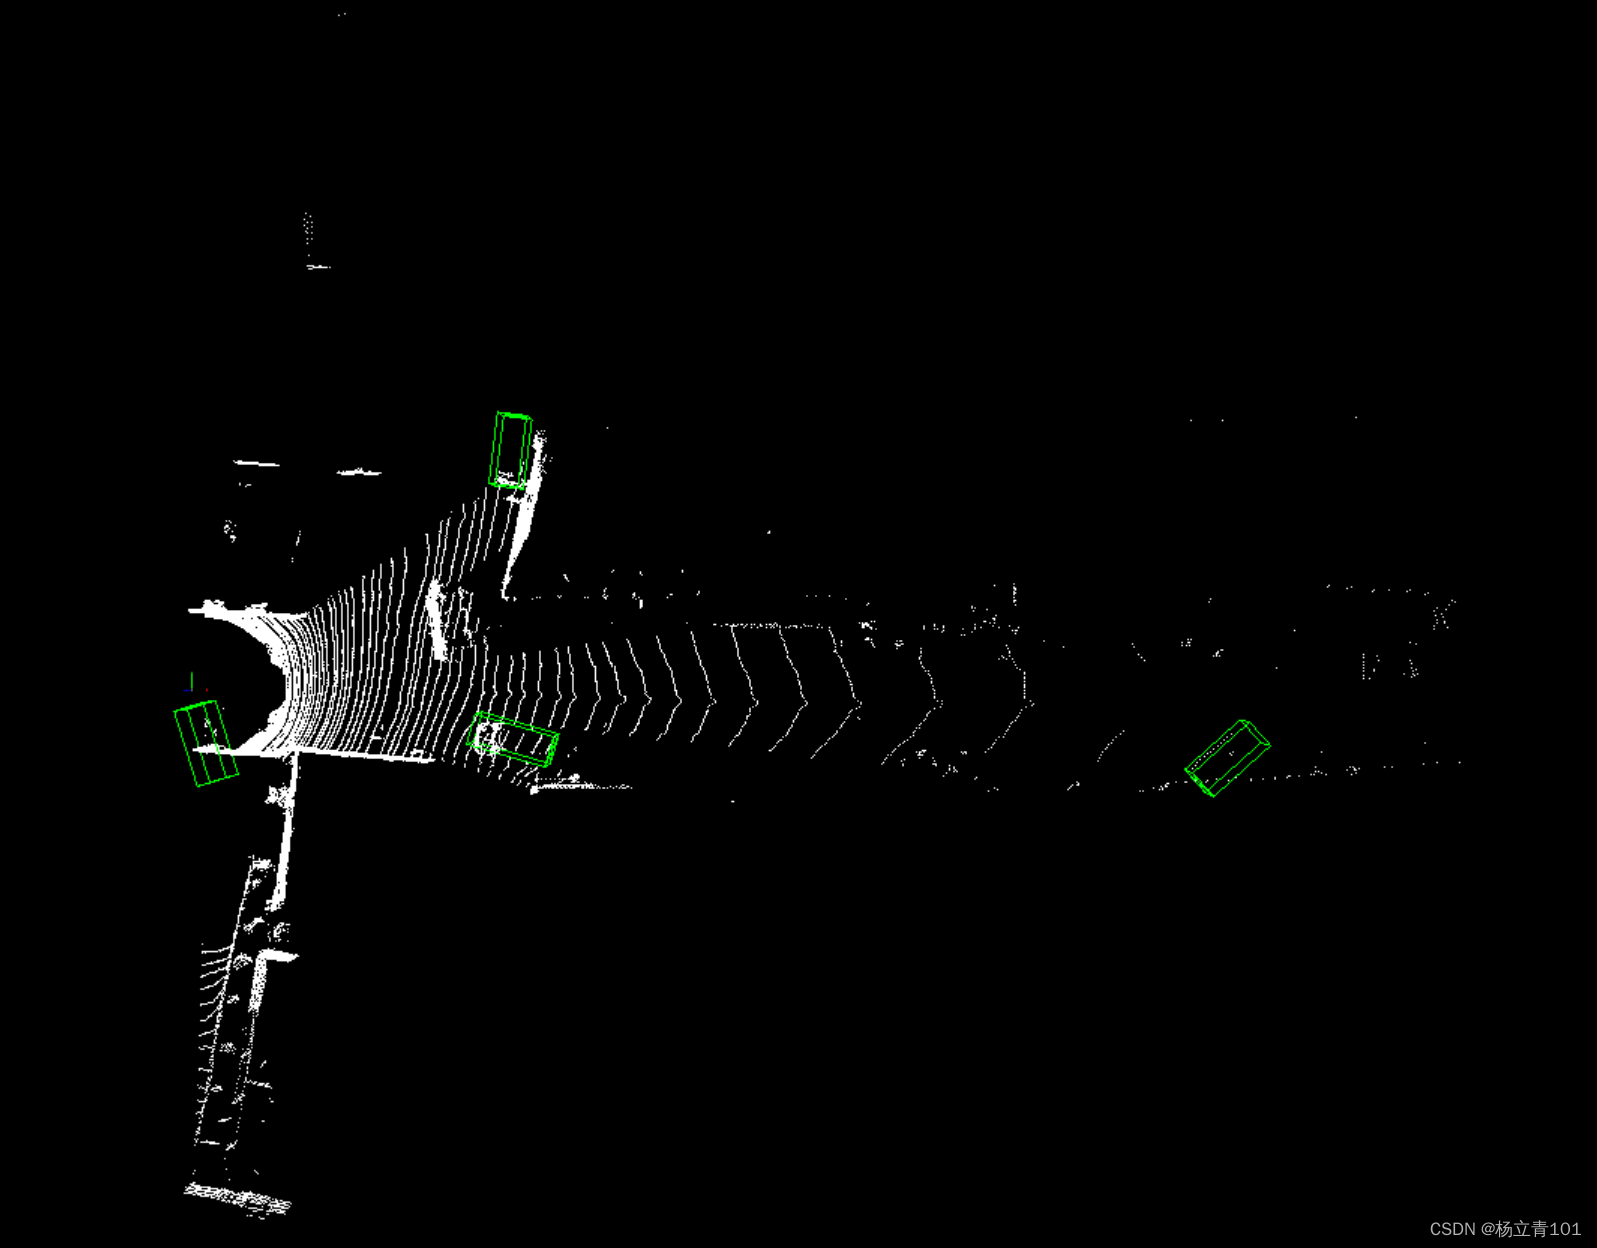
版权归原作者 杨立青101 所有, 如有侵权,请联系我们删除。