
下载地址:https://www.elastic.co/cn/downloads/elasticsearch
当前版本:8.3.3
一、环境准备
创建一个文件夹
mkdir /elk
,用于作为安装目录,当然实际可能不是这样的文件结构,仅用于测试情况。
Elasticsearch不允许用root启动,创建一个新用户elkuser,并将elk文件夹的权限给他。
创建用户:adduser elkuser
创建密码: passwd elkuser             例如:   123456
修改文件全限: chown -R elkuser /elk
切换用户: su elkuser
二、Elasticsearch
1. 下载
下载elasticsearch
wget https://artifacts.elastic.co/downloads/elasticsearch/elasticsearch-8.3.3-linux-x86_64.tar.gz
tar -xzf elasticsearch-8.3.3-linux-x86_64.tar.gz
2. 启动elasticsearch
cd elasticsearch-8.3.3/
bin/elasticsearch
若想要后台方式启动,使用-d参数 ,首次启动建议不用:
bin/elasticsearch -d
会出现如下提示,默认启动了安全认证,包括elastic的用户名密码及相关token,将内容记录下来(忘记了后期也可以重置):
━
✅ Elasticsearch security features have been automatically configured!
✅ Authentication is enabled and cluster connections are encrypted.

ℹ️  Password for the elastic user (reset with `bin/elasticsearch-reset-password -u elastic`):
  EIMr234wer234zQS2B

ℹ️  HTTP CA certificate SHA-256 fingerprint:
  3a76d5d4e9ec3e.........337c4ec0b366c81ef3a53d

ℹ️  Configure Kibana to use this cluster:
• Run Kibana and click the configuration linkin the terminal when Kibana starts.
• Copy the following enrollment token and paste it into Kibana in your browser (valid for the next 30 minutes):
  eyJ2ZXIiOiI4LjMuMyYjU1MjgzNmZjODE4NzAyYW1M2QiLCJrZXkiOiI4WGxEU1lJQmRVQnhHdmJEUmlsejpsTjB0STBfTVFJYUNEQXhTbFZZajd3In0=

ℹ️  Configure other nodes to join this cluster:
• On this node:
  ⁃ Create an enrollment token with `bin/elasticsearch-create-enrollment-token -s node`.
  ⁃ Uncomment the transport.host setting at the end of config/elasticsearch.yml.
  ⁃ Restart Elasticsearch.
• On other nodes:
  ⁃ Start Elasticsearch with `bin/elasticsearch --enrollment-token <token>`, using the enrollment token that you generated.
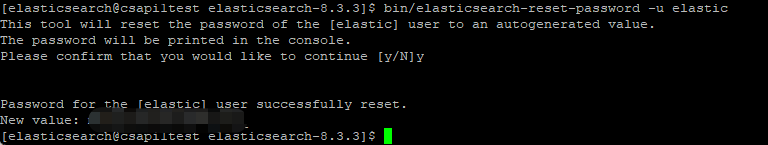
重置密码:
bin/elasticsearch-reset-password -u elastic
3.常见错误一:can not run elasticsearch as root
elasticsearch 不允许用root方式启动,见环境准备部分
4. exception during geoip databases update
此版本将GeoIp功能默认开启了采集。在默认的启动下是会去官网的默认地址下获取最新的Ip的GEO信息
在elasticsearch.yml中添加配置
ingest.geoip.downloader.enabled: false
5. Could not create plugin of type class org.apache.logging.log4j.core.appender.RollingFileAppender for element RollingFile
确认日志文件夹的权限,可以再次执行一下 1.1中设置权限的命令。
6. 访问9200端口提示received plaintext http traffic on an https channel, closing connection Netty4HttpCh
默认开启了ssl认证,可以考虑是否需要访问9200,仅用kibana即可。若需访问,则需要修改config/目录下面的elasticsearch.yml配置文件:
# Enable encryption for HTTP API client connections, such as Kibana, Logstash, and Agents
xpack.security.http.ssl:
  enabled: true
  keystore.path: certs/http.p12
将此处的【true】改为false
三、Kibana
1. 下载
下载Kibana , 解压
wget https://artifacts.elastic.co/downloads/kibana/kibana-8.3.3-linux-x86_64.tar.gz
tar -xzf kibana-8.3.3-linux-x86_64.tar.gz
2. 启动Kibana
./bin/kibana
会看到如下图样式提示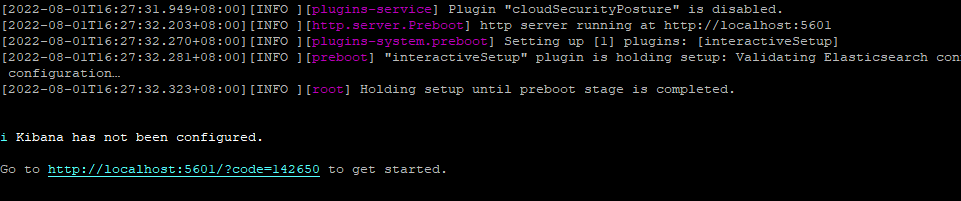
访问图中的地址进行配置,注意如果不是在当前主机上访问,localhost改为相应的IP。
默认不允许当前主机外访问,需修改kibana.yml 文件 如下:
server.host: "0.0.0.0"
访问改地址进行配置,需要填写安装Elasticsearch时生产的token。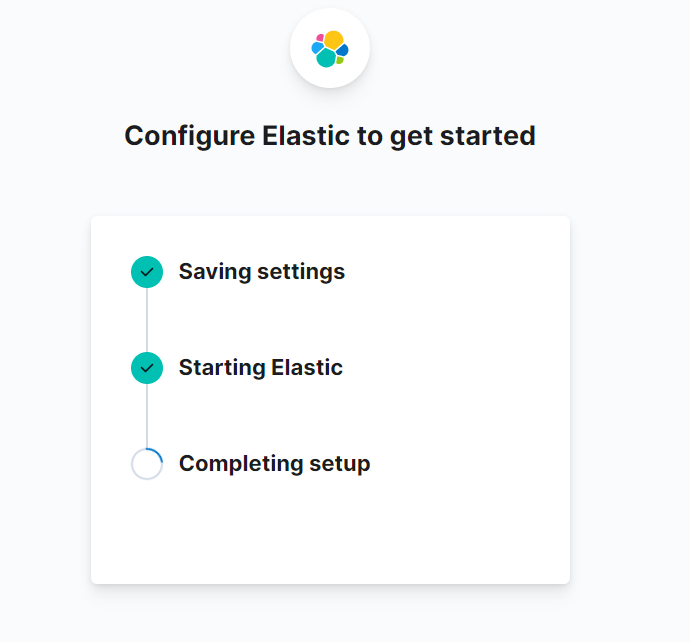
配置完可以用安装Elasticsearch时提示的用户进行登录了。
四、Filebeat
1. 下载
下载Filebeat , 解压
wget https://artifacts.elastic.co/downloads/beats/filebeat/filebeat-8.3.3-linux-x86_64.tar.gz
tar -xzf filebeat-8.3.3-linux-x86_64.tar.gz
2. 修改配置文件filebeat.yml,并链接到Elasticsearch
2.1 设置需要监控的日志文件
filebeat.inputs是一个集合,可以配置多个文件的监控,如下面配置
filebeat.inputs:

# 第一个监控
- type: filestream

  id: 自己定义个id
  enabled: true
  paths:
    - /opt/1.log

  # 可选,比如添加一个字段用于标识来源于不同文件
  fields:
    file_name: XXX
  fields_under_root: true

# 第二个监控
- type: filestream
  id: 自己定义个id2
  enabled: true
  paths:
    - /opt/2.log
  fields:
    file_name: YYY
  fields_under_root: true
2.2 链接到Elasticsearch
这里需要配置Elasticsearch 的IP、用户名密码及crt证书文件,这些都可以在安装Elasticsearch 的时候得到
# ---------------------------- Elasticsearch Output ----------------------------
output.elasticsearch:
  # Array of hosts to connect to.
  hosts: ["192.168.1.2:9200"]

  # Protocol - either `http` (default) or `https`.
  protocol: "https"

  # Authentication credentials - either API key or username/password.
  #api_key: "id:api_key"
  username: "elastic"
  password: "OqdCD234234dfsdf-2"
  ssl:
     certificate_authorities: "/elk/http_ca.crt"
3. 配置到kibana
执行如下命令启用相关的索引
./filebeat setup -e
4. 启动filebeat
./filebeat -e
5. 其他beat
配置都比较类似,例如metricbeat的配置文件主要也是链接到elasticsearch部分,这里不再列举。
五、后台启动相关组件
elasticsearch提供了-d的参数支持后台启动,其他的kibana 、filebeat貌似都没有,可以通过如下方式实现:
nohup ./filebeat -e &
nohup ./metricbeat -e &
nohup ./bin/kibana &
版权归原作者 FlyLolo 所有, 如有侵权,请联系我们删除。