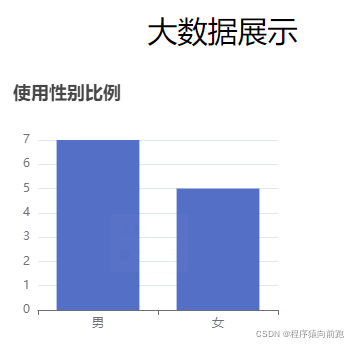
由于自己的项目需要大数据可视化,所以就得学习,对于数据的处理就是一个难事,我在想如何对男女这个数据进行处理,因为两个数据不可能存储在数据库中,所以就需要hashmap这种形式去存储,hashmap然后转换为list,因为男女人数是存储在另外一张表的,需要使用sql去计算男女人数。代码如下:
后端代码:
controller:
package com.controller;import com.alibaba.fastjson.JSON;import com.entity.Problem;import com.entity.R;import com.github.pagehelper.PageInfo;import com.service.DrugInfoService;import com.service.YonghuService;import com.service.impl.YonghuServiceImpl;import org.springframework.beans.factory.annotation.Autowired;import org.springframework.web.bind.annotation.RequestMapping;import org.springframework.web.bind.annotation.RequestParam;import org.springframework.web.bind.annotation.RestController;import java.util.*;

@RequestMapping("/dashuju")
@RestController
publicclassDashujuController{
    @Autowired
    private YonghuService yonghuService;

    @RequestMapping("/getnannv")publicRlist2(){
        String sex="男";
        String sex1="女";
        HashMap<String,Object> map=newHashMap<>();
        List<String> name=newArrayList<>();
        List<Integer> value=newArrayList<>();
        int man=yonghuService.getyonghunan(sex);
        int woman=yonghuService.getyonghunan(sex1);
        name.add(sex);
        name.add(sex1);
        value.add(man);
        value.add(woman);
        map.put("name",name);
        map.put("value",value);
        System.out.println(map);
        System.out.println(map);returnR.ok().put("data",map);}}
Dao层
部分代码:
//   大数据展示数据
   int getyonghunan(String xingbie);
mybatis.xml
用于统计数据的男女总数
<select id="getyonghunan" parameterType="com.entity.Yonghu"  resultType="java.lang.Integer">SELECTCOUNT(*)FROM yonghu AS s
        WHERE s.xingbie =#{xingbie}</select>
前端核心代码:
对于echart的安装需要自己去安装,我就不在写了
<template><div><div class="logo"><p>大数据展示</p></div><div id="myChart":style="{width: '300px', height: '300px'}"></div><!--<button @click="draw">点击刷新</button>--></div></template><script>exportdefault{
  name:'dashuju',data(){return{
      name:[],
      value:[],}},mounted(){this.drawLine();},created(){this.draw();},
  methods:{drawLine(){// 基于准备好的dom,初始化echarts实例let myChart =this.$echarts.init(document.getElementById('myChart'))// 绘制图表
      myChart.setOption({
        title:{ text:'使用性别比例'},
        tooltip:{},
        xAxis:{
          data:this.name
        },
        yAxis:{},
        series:[{
          name:'人数',
          type:'bar',
          data:this.value
        }]});},draw(){this.$http({
        url:"dashuju/getnannv",
        method:"get",}).then(({data})=>{if(data && data.code ===0){
          console.log(data.data)
          console.log(data.data)this.name=data.data.name;this.value=data.data.value;
          console.log(this.name)
          console.log(this.value)this.drawLine()}})}}}</script><style scoped>.logo{
  text-align: center;
  font-size:30px;
  margin-bottom:20px;}</style>


大功完成,哈哈哈,点个赞在走呗
版权归原作者 程序猿向前跑 所有, 如有侵权,请联系我们删除。