
刚学了Hadoop,在网上找完整的分析使用过程进行练手观看。本文数据和方法均来自于大佬的使用Hadoop分析气象数据完整版(附带完整代码)(侵删)
文章目录
注意:为了不出现横向拖拉,命令里我加了换行,所有命令都是如此。复制进命令行时记得去掉换行!
1.获取数据
1.1下载数据
wget -D --accept-regex=REGEX -P data-r
    -c ftp://ftp.ncdc.noaa.gov/pub/data/noaa/isd-lite/2019/5*
下载时可能会出现卡顿中断下载,按Ctrl+c结束下载,然后重复下载就可以了(网不好的多试几次)
我是全部下载完了,我这时候一共有这么多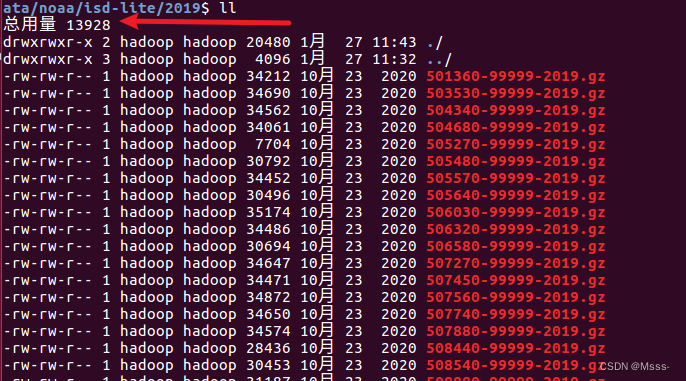
1.2 数据格式
截取部分数据,格式如下:
2019 01 01 00   -65  -123 10199   345    95     8 -9999 -9999
2019 01 01 01   -62  -115 10213   350    86 -9999 -9999 -9999
2019 01 01 02   -62  -110 10223   343    86 -9999 -9999 -9999
2019 01 01 03   -62  -114 10234   337    77 -9999 -9999 -9999
2019 01 01 04   -62  -118 10242   345    86 -9999 -9999 -9999
2019 01 01 05   -62  -116 10252   331    63 -9999 -9999 -9999
2019 01 01 06   -62  -114 10259   306    38     6 -9999 -9999
2019 01 01 07   -62  -114 10264   281    29 -9999 -9999 -9999
2019 01 01 08   -62  -113 10268   268    39 -9999 -9999 -9999
2019 01 01 09   -59  -116 10271   254    31     3 -9999 -9999
2019 01 01 10   -62  -115 10271   238    24 -9999 -9999 -9999
2019 01 01 11   -80  -122 10269   254    12 -9999 -9999 -9999
2019 01 01 12   -67  -103 10264   322    12     5 -9999 -9999
2019 01 01 13   -62  -100 10261    27    13 -9999 -9999 -9999
2019 01 01 14   -29   -72 10259   230    40 -9999 -9999 -9999
2019 01 01 15   -20   -67 10254   242    49     5 -9999 -9999
字段解释如下:
字段1:位置1-4,长度4:观测年份,四舍五入到最接近
字段2:位置6-7,长度2:观察月,四舍五入到最接近
字段3:位置9-11,长度2:观察日,四舍五入到最接近
字段4:位置12-13,长度2:观察时,四舍五入到最接近
字段5:位置14-19,长度6:空气温度,单位:摄氏度,比例因子:10,缺少值:-9999,
字段6:位置20-24,长度6:露点温度,为了达到饱和,必须在恒定的压力和水蒸气含量下
    冷却给定的空气包的温度。单位:摄氏度,比例因子:10,缺少值:-9999
字段7:Pos 26-31,长度6:海平面压力,相对于平均海平面的气压。单位:公顷,比例因
    子:10,缺少值:-9999
字段8:32-37号位置,长度6:风向。正北角在正北和风向之间以顺时针方向测量的角度。
    单位:角度。比例因子:1,缺少值:-9999。*注:静风风向编码为0。
字段9:38-43位置,长度6:风速,空气通过一个固定点的水平运动速度。单位:米每秒。
    比例因子:10。缺少值:-9999
字段10:位置44-49,长度6:天空状况总覆盖代码,表示被云层或其它遮蔽现象覆盖的整个穹
    顶的一部分的代码。缺少值:-9999
    域:
        0:无,SKC或CLR
        1: 一个okta-1/10或更小但不是零
        2: 两个oktas-2/10-3/10,或几个
        3: 三个oktas-4/10
        4: 四个oktas-5/10,或SCT
        5: 五个oktas-6/10
        6: 六个oktas-7/10-8/10
        7: 七个oktas-9/10或以上,但不是10/10或BKN
        8: 八个oktas-10/10,或OVC
        9: 天空模糊不清,或云量无法估计
        10: 部分遮蔽
        11: 稀散
        12: 分散的
        13: 暗散射
        14: 薄断
        15: 破碎的
        16: 暗断
        17: 薄阴
        18: 阴天
        19: 阴天
字段11:位置50-55,长度6:液体沉淀深度尺寸-持续一小时,在一个小时的积累期内测量
    的液体沉淀的深度。单位:毫米,比例因子:10,缺少值:-9999。*注:痕量降水编码为-1
字段12:位置56-61,长度6:液体沉淀深度尺寸-持续6小时,在六小时的积累期内测量的液
    体沉淀的深度。单位:毫米。比例因子:10。缺少值:-9999。*注:痕量降水编码为-1
字段很多,但是这里我只用前5个字段,任务是统计每日最高温度、最低温度、平均温度,有时间的话顺便计算点儿静态统计值。其余字段应该是类似的,正所谓一通百通。
1.3 合并数据
数据很分散,合并数据:将2019目录下的所有以.gz结尾的的文件合并到data.txt
zcat 2019/*.gz > data.txt
到此数据获取完毕
2.MapReduce处理数据
2.1 环境配置,启动集群
可以查看原作者的文章: 大数据学习系列:Hadoop3.0苦命学习(一),本文不再赘述。
2.2 文件上传到HDFS
要保证hadoop已经启动
hdfs dfs -mkdir -p /usr/hadoop/in
hdfs dfs -ls/usr/hadoop/
hdfs dfs -put data.txt /usr/hadoop/in/
查看是否上传成功
hdfs dfs -ls/usr/hadoop/in

2.3 编写MapReduce代码
2.3.1 TemperatureMapper
publicclassTemperatureMapperextendsMapper<LongWritable,Text,Text,LongWritable>{privatestaticfinallongMISSING=-9999;@Overrideprotectedvoidmap(LongWritable key,Text value,Context context)throwsIOException,InterruptedException{String line = value.toString();Iterable<String> split =Splitter.on(" ").omitEmptyStrings().split(line);ArrayList<String> arrayList =newArrayList<>(16);for(String s : split){
            arrayList.add(s);}// 过滤掉字段不足的数据if(arrayList.size()>=5){String month = arrayList.get(1);String day = arrayList.get(2);long temperature =Long.parseLong(arrayList.get(4));// 过滤掉温度不存在的数据if(Math.abs(temperature -MISSING)>0.0001){
                context.write(newText(month +"/"+ day),newLongWritable((temperature)));}}}}
主要是原数据进行了清洗,过滤了一些不合格的数据。
2.3.2 TemperatureReducer
publicclassTemperatureReducerextendsReducer<Text,LongWritable,Text,Temperature>{@Overrideprotectedvoidreduce(Text key,Iterable<LongWritable> values,Context context)throwsIOException,InterruptedException{long maxTemperature =Long.MIN_VALUE;long minTemperature =Long.MAX_VALUE;double avgTemperature =0.0;long temp;int count =0;if(values!=null){for(LongWritable value: values){
                temp = value.get();
                maxTemperature =Math.max(temp, maxTemperature);
                minTemperature =Math.min(temp, minTemperature);
                avgTemperature += temp;
                count++;}Temperature temperature =newTemperature(maxTemperature,
                    minTemperature, avgTemperature/count);

            context.write(key, temperature);}}}
计算出每日温度的最大值、最小值和平均值,并放入
Temperature
对象中。
2.3.3 JobMain
publicclassJobMainextendsConfiguredimplementsTool{@Overridepublicintrun(String[] strings)throwsException{// 创建一个任务对象Job job =Job.getInstance(super.getConf(),"mapreduce_temperature");// 打包放在集群运行时,需要做一个配置
        job.setJarByClass(JobMain.class);// 第一步:设置读取文件的类:K1和V1
        job.setInputFormatClass(TextInputFormat.class);TextInputFormat.addInputPath(job,newPath("hdfs://node01:8020/usr/hadoop/in"));// 第二步:设置Mapper类
        job.setMapperClass(TemperatureMapper.class);// 设置Map阶段的输出类型:k2和v2的类型
        job.setMapOutputKeyClass(Text.class);
        job.setMapOutputValueClass(LongWritable.class);// 第三、四、五、六步采用默认方式(分区,排序,规约,分组)// 第七步:设置Reducer类
        job.setReducerClass(TemperatureReducer.class);// 设置Reduce阶段的输出类型
        job.setOutputKeyClass(Text.class);
        job.setOutputValueClass(Temperature.class);// 第八步:设置输出类
        job.setOutputFormatClass(TextOutputFormat.class);// 设置输出路径TextOutputFormat.setOutputPath(job,newPath("hdfs://node01:8020/usr/hadoop/temperature"));boolean b = job.waitForCompletion(true);return b?0:1;}publicstaticvoidmain(String[] args)throwsException{Configuration configuration =newConfiguration();// 启动一个任务ToolRunner.run(configuration,newJobMain(), args);}}
2.4 执行程序
2.4.1 打包上传
可以百度一下
2.4.2 运行
hadoop jar temperature_test-1.0-SNAPSHOT.jar cn.sky.hadoop.JobMain
temperature_test-1.0-SNAPSHOT.jar 为打包后的jar包名
cn.sky.hadoop.JobMain 主程序的目录名
下面为我分析后的数据部分截图。因为我们每个人取得不一样,所以这部分也会一样,出来结果就行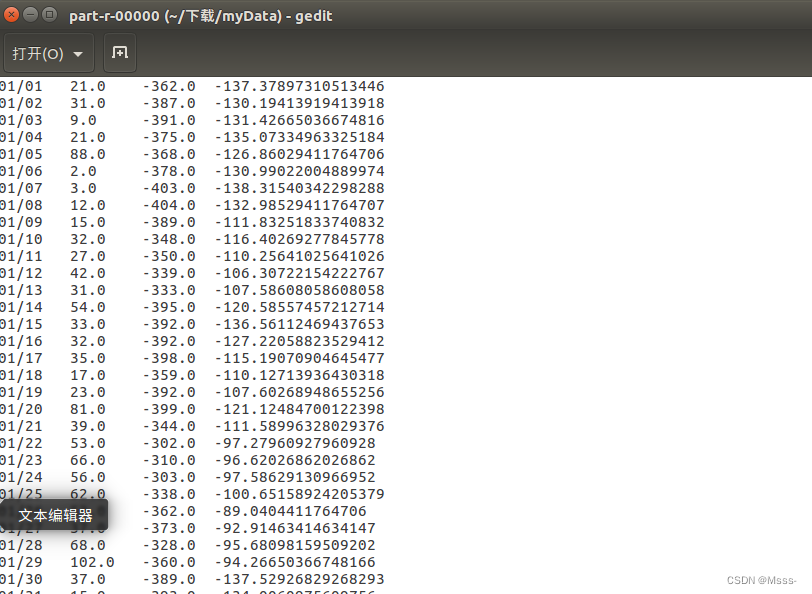
3.导入数据到Hive
关于Hive的介绍可以看原作者的博文大数据学习系列:Hadoop3.0苦命学习(五)
有个问题,若直接从HDFS导入数据到Hive,HDFS上的数据会丢失。
所以我将数据下载下来,重命名为 ```temperature_data ``
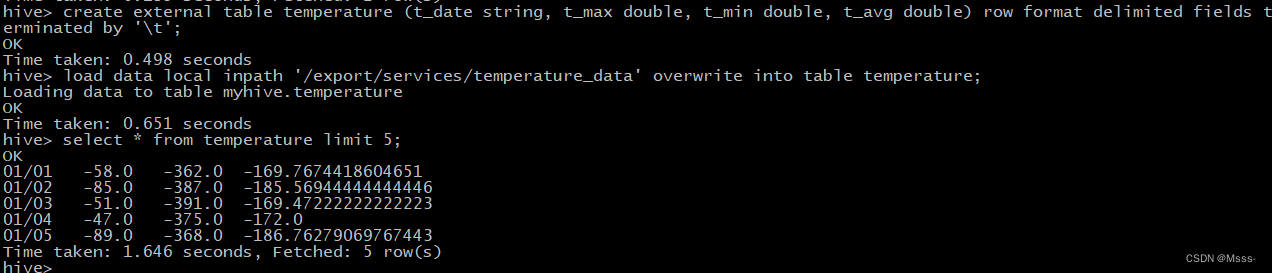
数据有了,开始创建Hive表:
 create external table temperature (t_date string, t_max double,
     t_min double, t_avg double) row format delimited fields terminated by '\t';
加载数据到hive:
load data local inpath '/export/services/temperature_data' overwrite
    into table temperature;
查前面5条数据,看一眼:
select*from temperature limit 5;
4.Hive数据分析
弄得简单,就查几个静态数据吧。
4.1 查询2019全年平均温度
select avg(t_avg) from temperature;
最终结果是68.77(因为数据是被放大了10倍)左右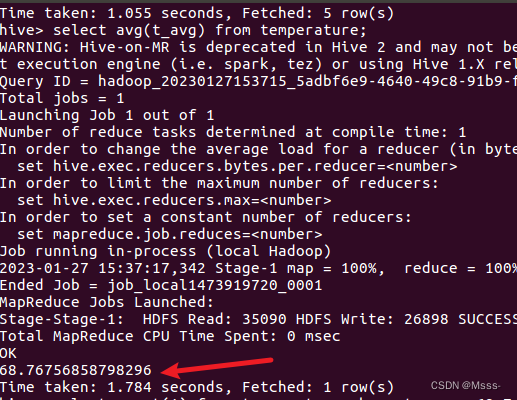
4.2 查询2019全年高于平均温度的天数
select count(1) from temperature where t_avg > 68.7;
答案是:198天,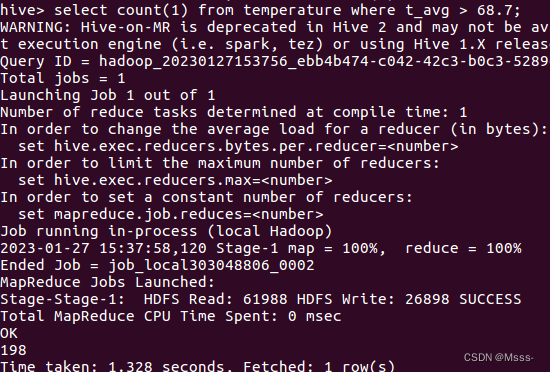
结束演示,查询别的数据可以再自己写相关的语句
5.使用Sqoop导入数据到Mysql
关于Sqoop的相关介绍可以查看原作者的博文大数据学习系列:Hadoop3.0苦命学习(七)
在使用前保证已经安装好MySQL
5.1Mysql创建数据库
CREATE TABLE `temperature` (
  `Tem_Date` varchar(10) NOT NULL,
  `Tem_Max` double DEFAULT NULL,
  `Tem_Min` double DEFAULT NULL,
  `Tem_Avg` double DEFAULT NULL,
  PRIMARY KEY (`Tem_Date`)) ENGINE=InnoDB DEFAULT CHARSET=utf8
5.2 开始导入
bin/sqoop export --connect jdbc:mysql://192.168.0.102:3306/userdb
    --username root --password 123456 --table temperature
    --export-dir/usr/hadoop/temperature --input-fields-terminated-by "\t"
可以去MySQL查看一下自己的数据。
但是这里我自己操作时没有使用Sqoop成功。也没有使用Linux环境下的数据库。所以是将数据导入到WIndows中来了
6.展示数据
这里前端使用echart,jsp,后端使用Spring、SpringMVC、Mybatis。
代码较多,展示主要的。
6.1 前端代码
主要是这一段,使用Ajax向后台请求数据,然后将数据丢进eChart中。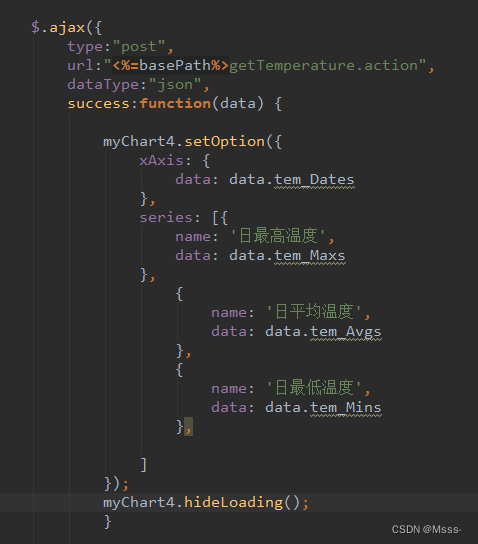
6.2 后端代码
controller层
@AutowiredprivateTemperatureService tempService;@RequestMapping("/getTemperature.action")@ResponseBodypublicTemperatureReturnPojogetTemperature(){TemperatureReturnPojo temperaturePojo = tempService.getAllTemperature();System.out.println(temperaturePojo);return temperaturePojo;}
Service层
publicinterfaceTemperatureService{TemperatureReturnPojogetAllTemperature();}
Service实现类
@ServicepublicclassTemperatureServiceImplimplementsTemperatureService{@AutowiredprivateTemperatureMapper temperatureMapper;@OverridepublicTemperatureReturnPojogetAllTemperature(){TemperatureReturnPojo temperatureReturnPojo
            =newTemperatureReturnPojo();ArrayList<String> dates =newArrayList<>();ArrayList<String> maxs =newArrayList<>();ArrayList<String> mins =newArrayList<>();ArrayList<String> avgs =newArrayList<>();DecimalFormat df =newDecimalFormat("#.00");List<TemperaturePojo> allTemperature
            = temperatureMapper.getAllTemperature();for(TemperaturePojo pojo : allTemperature){
            dates.add(pojo.getTem_Date());
            maxs.add(df.format(pojo.getTem_Max()/10.0));
            mins.add(df.format(pojo.getTem_Min()/10.0));
            avgs.add(df.format(pojo.getTem_Avg()/10.0));}
        temperatureReturnPojo.setTem_Dates(dates);
        temperatureReturnPojo.setTem_Maxs(maxs);
        temperatureReturnPojo.setTem_Mins(mins);
        temperatureReturnPojo.setTem_Avgs(avgs);return temperatureReturnPojo;}}
实体类
publicclassTemperaturePojo{privateStringTem_Date;privateDoubleTem_Max;privateDoubleTem_Min;privateDoubleTem_Avg;// 省略Get()、Set()、ToString()方法 }publicclassTemperatureReturnPojo{privateList<String>Tem_Dates;privateList<String>Tem_Maxs;privateList<String>Tem_Mins;privateList<String>Tem_Avgs;// 省略Get()、Set()、ToString()方法 }
Mapper
publicinterfaceTemperatureMapper{List<TemperaturePojo>getAllTemperature();}
<mapper namespace="cn.itcast.weblog.mapper.TemperatureMapper"><select id="getAllTemperature"
            resultType="cn.itcast.weblog.pojo.TemperaturePojo">
        select * from temperature;</select></mapper>
页面运行结果展示

流程完成,撒花~~~
原作者的代码链接:GitHub链接–Hadoop-Analyzes-Weather-Data
问题解决
原作者的前端代码的这个Index.jsp文件可以直接替换到外边那个index就可以直接启动Tomcat后访问到了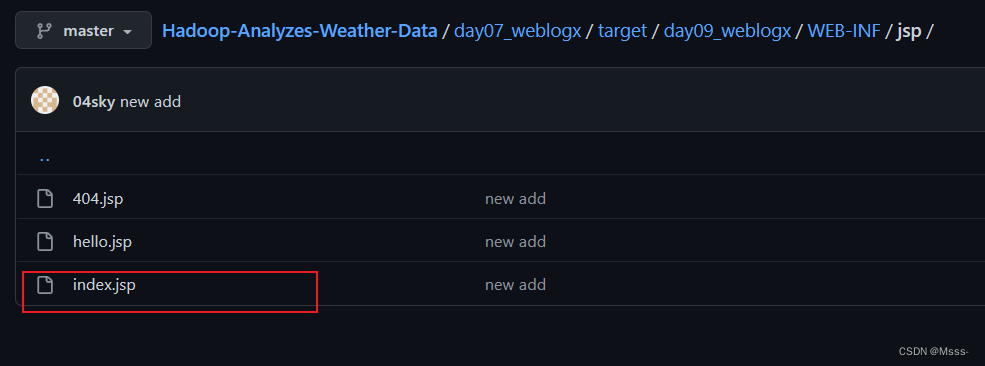
版权归原作者 没反应说说说 所有, 如有侵权,请联系我们删除。